BLOG


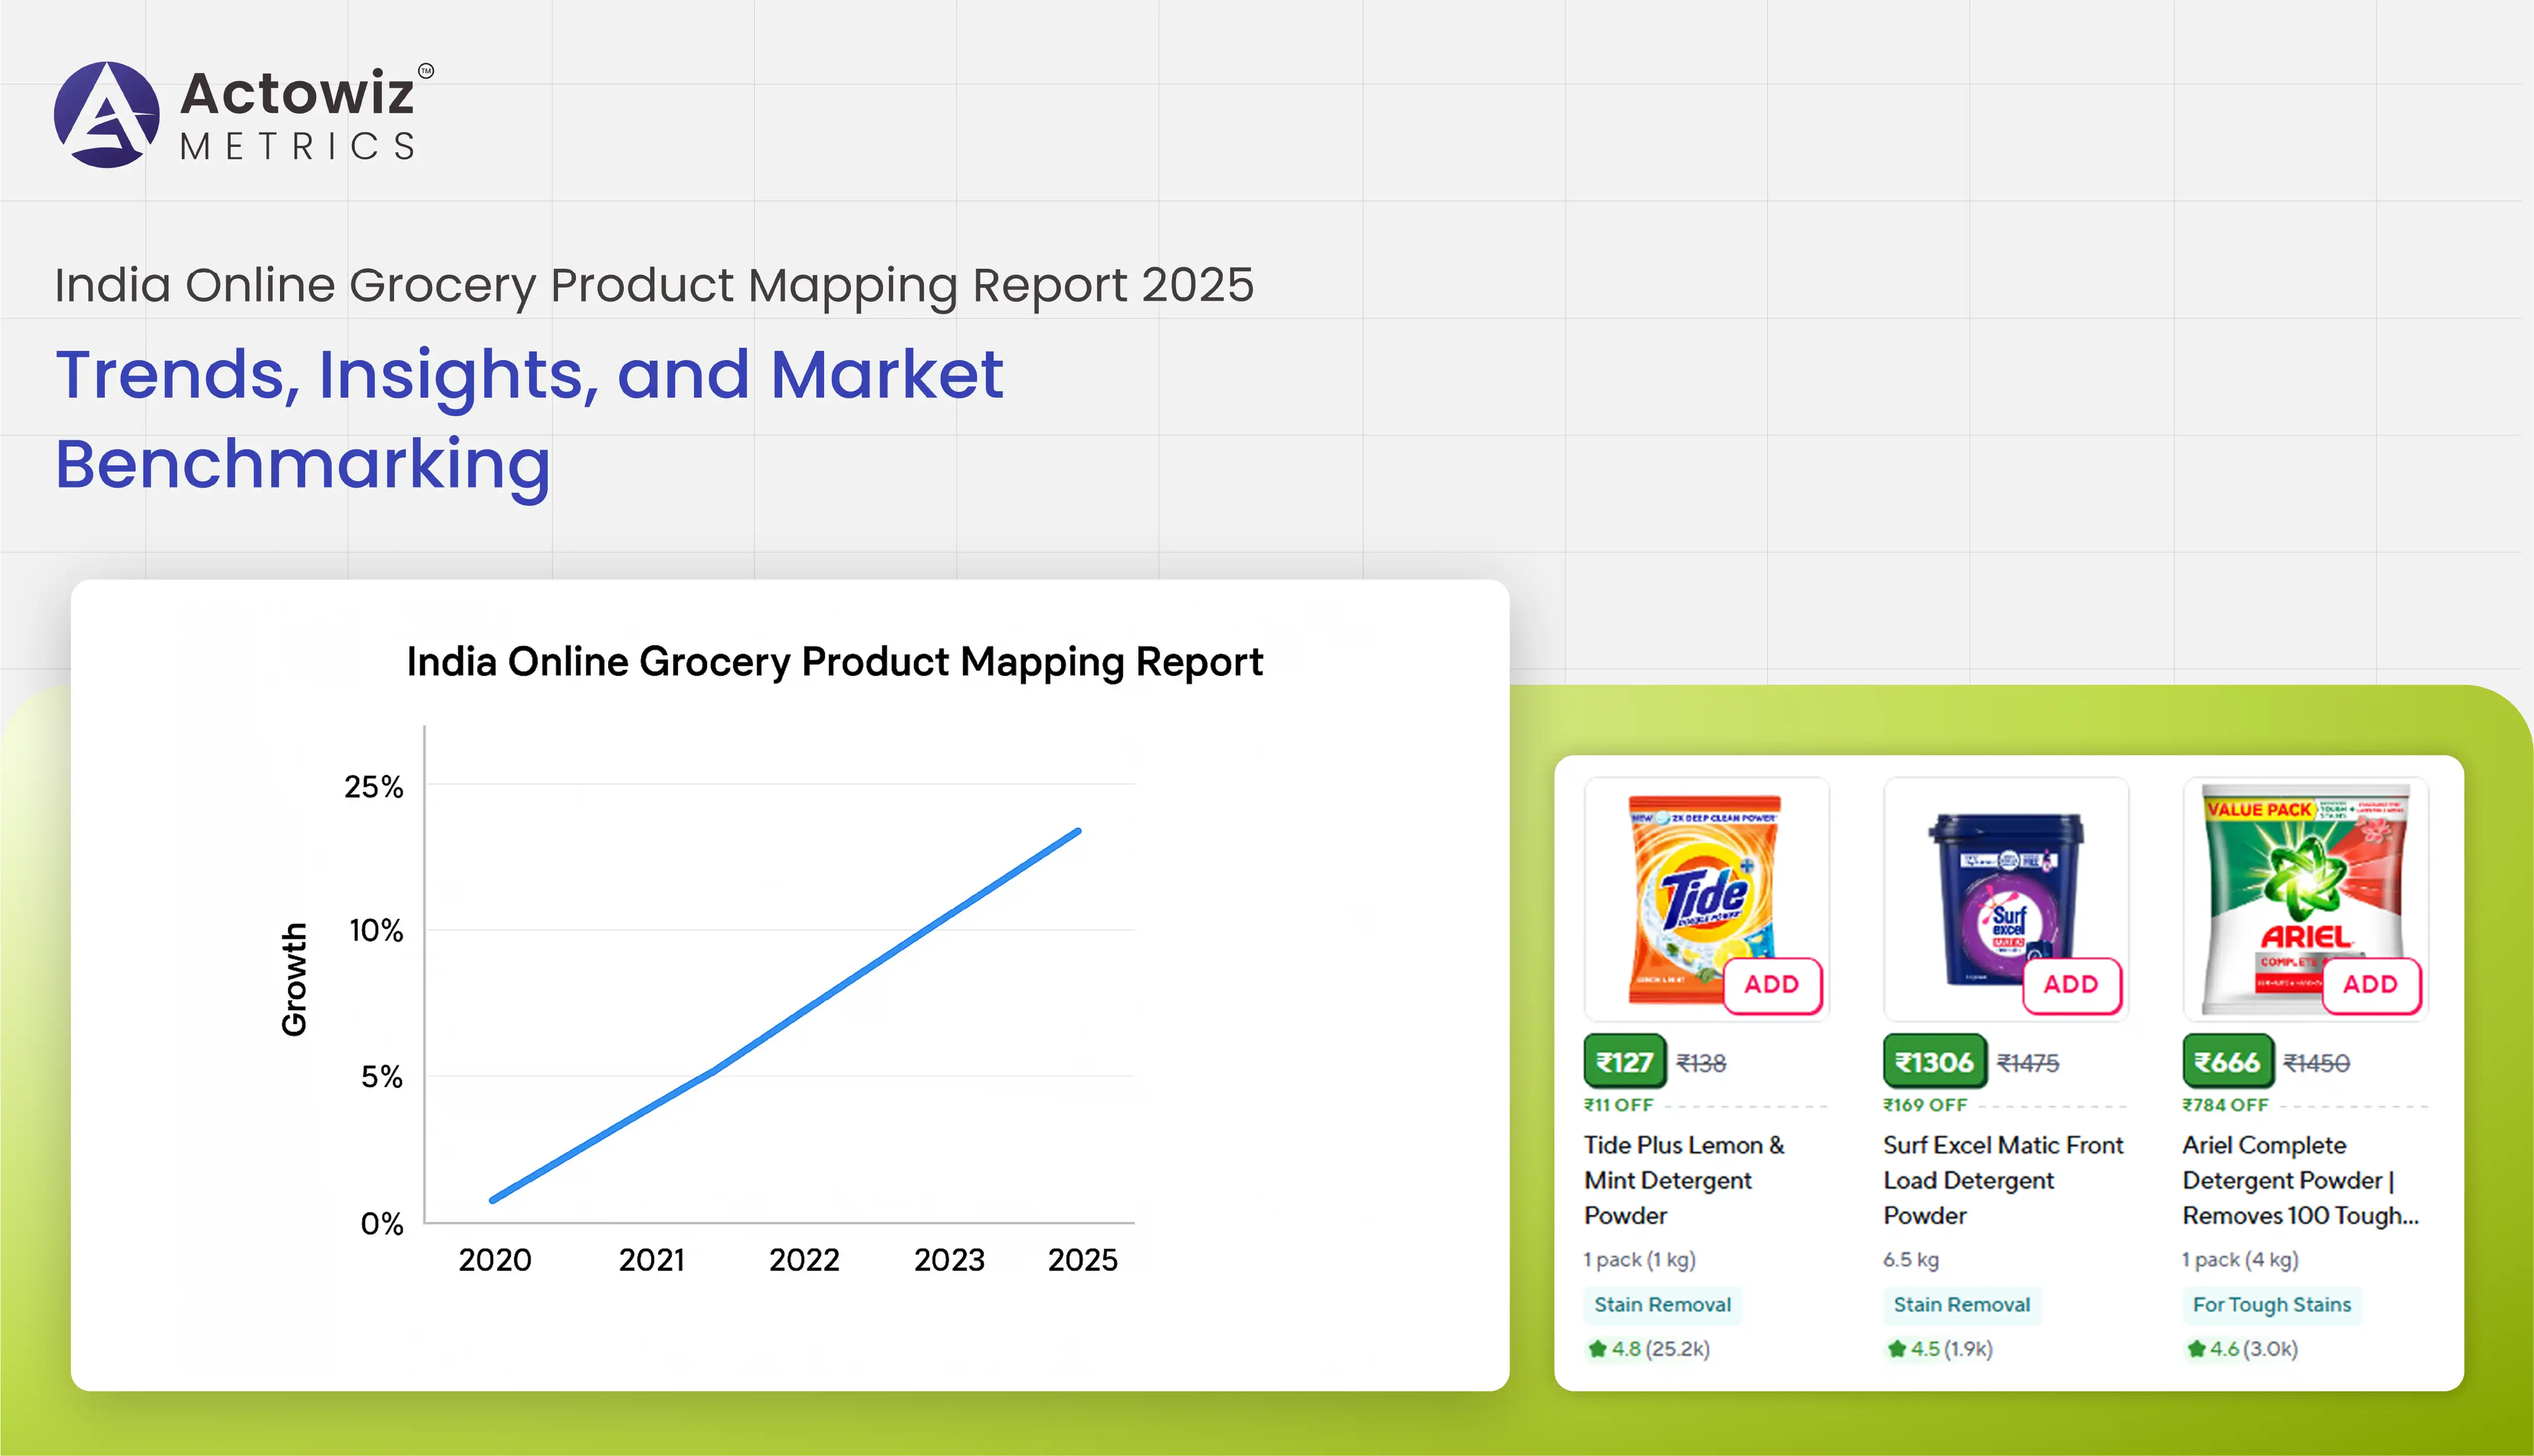
The growth of online grocery retail in India has transformed consumer shopping patterns and retailer strategies. The India Online Grocery Product Mapping Report 2025 provides an in-depth analysis of product assortments, pricing trends, and market benchmarks across leading e-commerce platforms. By leveraging Grocery Analytics, retailers and brands can identify category gaps, optimize product listings, and improve shelf performance. From 2020 to 2025, the Indian online grocery market has grown at a CAGR of 18%, driven by increased smartphone penetration, faster delivery networks, and evolving consumer preferences. Accurate product mapping enables businesses to track SKUs, monitor competitive pricing, and understand demand patterns at a granular level. Retailers using data-driven insights can enhance inventory management, tailor promotions, and ensure a superior digital shopping experience. This report combines historical data, platform-level insights, and actionable benchmarks, offering a comprehensive overview for stakeholders aiming to optimize their online grocery strategy in India.
The role of Grocery Product Mapping Analytics 2025 in India has become indispensable for understanding SKU-level assortment and availability. By employing Product Data Tracking, e-commerce platforms can monitor changes in inventory, promotions, and category performance across leading grocery websites. Between 2020 and 2025, the number of SKUs tracked across India’s top 10 online grocery platforms grew from 1.2 million to 2.8 million, reflecting the rapid expansion of product variety. Retailers can identify high-demand categories, seasonal trends, and underrepresented items, enabling better assortment planning.
| Year | SKUs Tracked (Million) | Categories Monitored | Price Updates Recorded |
|---|---|---|---|
| 2020 | 1.2 | 150 | 350,000 |
| 2021 | 1.5 | 160 | 410,000 |
| 2022 | 1.8 | 170 | 480,000 |
| 2023 | 2.1 | 180 | 550,000 |
| 2024 | 2.5 | 190 | 620,000 |
| 2025 | 2.8 | 200 | 700,000 |
Using advanced mapping analytics and tracking tools, businesses
Using advanced mapping analytics and tracking tools, businesses can improve demand forecasting, optimize stock levels, and maintain competitive advantage in a highly dynamic market.
Product Mapping for Indian Grocery Platforms is critical to benchmark pricing, availability, and promotions across multiple channels. Price Benchmarking helps retailers identify discrepancies in product pricing and ensure competitiveness. From 2020 to 2025, the average price difference for key grocery categories across platforms ranged between 5% and 12%, emphasizing the importance of real-time monitoring.
| Year | Avg Price Deviation (%) | Promotions Tracked | Platforms Monitored |
|---|---|---|---|
| 2020 | 5.2 | 1,100 | 8 |
| 2021 | 6.0 | 1,300 | 9 |
| 2022 | 7.5 | 1,500 | 10 |
| 2023 | 8.8 | 1,700 | 10 |
| 2024 | 10.0 | 2,000 | 11 |
| 2025 | 11.5 | 2,300 | 12 |
Through consistent price benchmarking, businesses can adjust pricing strategies, plan promotions effectively, and improve overall digital shelf visibility for high-demand grocery categories.
Online Grocery Product Data Extraction India enables brands to collect SKU-level data, monitor competitor strategies, and track availability in real time. Coupled with Competitor Analysis, this provides insights into product assortment, pricing trends, and promotional effectiveness. Between 2020 and 2025, the number of active online grocery SKUs monitored for competitors grew from 0.9 million to 2.4 million. Platforms like BigBasket, Grofers, Amazon Pantry, and Flipkart Supermart became key sources for strategic insights.
| Year | Competitor SKUs Monitored | Promotions Tracked | Key Platforms |
|---|---|---|---|
| 2020 | 0.9 M | 850,000 | 5 |
| 2021 | 1.2 M | 950,000 | 6 |
| 2022 | 1.5 M | 1,100,000 | 7 |
| 2023 | 1.8 M | 1,300,000 | 8 |
| 2024 | 2.1 M | 1,500,000 | 9 |
| 2025 | 2.4 M | 1,700,000 | 10 |
Extracting competitor data ensures informed decision-making for assortment optimization, pricing alignment, and effective promotional planning.
Grocery Product Mapping Insights India allows retailers to apply Digital Shelf Analytics to understand product visibility, ranking, and performance online. From 2020 to 2025, average product visibility across top platforms increased from 60% to 78%, reflecting the growing importance of curated product placement and digital marketing efforts.
| Year | Avg Product Visibility (%) | Digital Shelf Errors (%) | Promotions Visibility (%) |
|---|---|---|---|
| 2020 | 60 | 12 | 55 |
| 2021 | 63 | 11 | 58 |
| 2022 | 67 | 10 | 62 |
| 2023 | 70 | 9 | 65 |
| 2024 | 74 | 8 | 70 |
| 2025 | 78 | 7 | 74 |
Insights derived from product mapping help optimize shelf strategy, enhance visibility, and improve conversion rates on e-commerce grocery platforms.
Cross-Platform Grocery Product Mapping in India enables monitoring of MAP (Minimum Advertised Price) and competitive pricing across multiple online stores. MAP Monitoring ensures compliance and helps retailers maintain consistent pricing. Between 2020 and 2025, MAP violations decreased by 15% as platforms increasingly enforced pricing policies.
| Year | Platforms Monitored | MAP Violations Detected | Corrective Actions Taken |
|---|---|---|---|
| 2020 | 6 | 1,200 | 900 |
| 2021 | 7 | 1,150 | 950 |
| 2022 | 8 | 1,100 | 1,000 |
| 2023 | 9 | 1,000 | 1,050 |
| 2024 | 10 | 950 | 1,100 |
| 2025 | 12 | 850 | 1,200 |
Cross-platform mapping and MAP monitoring help maintain pricing integrity, improve brand trust, and enhance revenue predictability.
The India Online Grocery Product Mapping Report 2025 consolidates insights from multiple platforms, including SKU-level assortment, pricing trends, promotions, and digital shelf performance. From 2020 to 2025, the online grocery market share of top 10 platforms increased from 45% to 62%, highlighting the need for accurate and up-to-date product mapping. This comprehensive mapping enables businesses to benchmark performance, optimize category assortment, and identify growth opportunities.
| Year | Top 10 Platform Market Share (%) | SKUs Monitored (Million) | Promotions Tracked |
|---|---|---|---|
| 2020 | 45 | 1.5 | 900,000 |
| 2021 | 48 | 1.8 | 1,050,000 |
| 2022 | 52 | 2.1 | 1,200,000 |
| 2023 | 55 | 2.4 | 1,350,000 |
| 2024 | 59 | 2.6 | 1,500,000 |
| 2025 | 62 | 2.8 | 1,700,000 |
Comprehensive product mapping allows retailers to make data-driven decisions, ensuring optimized online grocery performance across India.
Actowiz Metrics provides end-to-end capabilities for Product Data Tracking and actionable insights. Businesses can leverage Grocery Product Mapping Analytics 2025 to monitor SKUs, benchmark pricing, track promotions, and improve category performance. Our tools enable automated data extraction, competitor analysis, and digital shelf monitoring across all major grocery e-commerce platforms. Retailers using Actowiz gain visibility into SKU-level assortment, identify pricing discrepancies, and implement effective promotional strategies, enhancing overall e-commerce efficiency and profitability. By adopting these solutions, businesses can maintain a competitive edge, respond faster to market changes, and optimize product offerings for maximum consumer engagement.
The India Online Grocery Product Mapping Report 2025 highlights key trends, insights, and benchmarks necessary for success in India’s fast-growing online grocery market. By leveraging product mapping, price monitoring, and digital shelf analytics, retailers can optimize assortment, track competitors, and maximize ROI. Actowiz Metrics empowers businesses to extract actionable insights, maintain competitive advantage, and drive growth across India’s online grocery sector.
Expert blogs, research reports and infographics — practical, data-driven reading across e-commerce and quick-commerce.
Most fields are optional — the more you share, the better your sample.


.webp "infographics")
.webp "infographics")


