BLOG


The Indian QSR (Quick Service Restaurant) market has witnessed exponential growth between 2020 and 2026, with major brands expanding aggressively into Tier 1, 2, and 3 cities. Understanding the distribution and density of outlets is critical for market positioning, competitive benchmarking, and strategic planning.
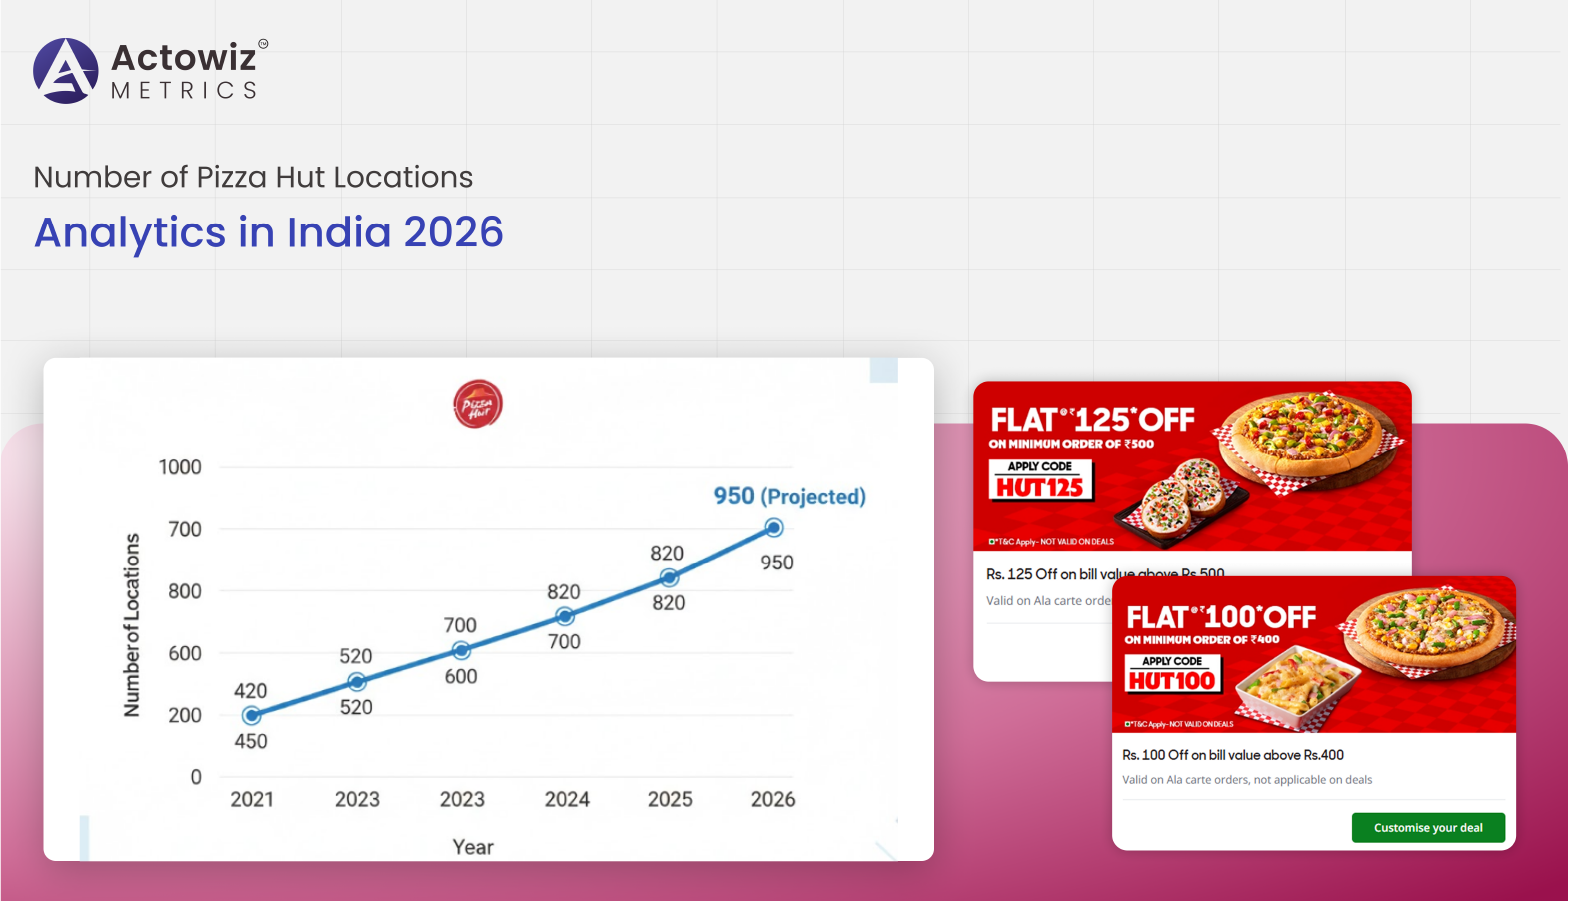
This report focuses on Number of Pizza Hut Locations Analytics in India 2026 to provide detailed insights into store distribution, city-wise penetration, and regional market performance. Using advanced Digital Shelf Analytics, we track outlet growth, cluster density, and trends over a six-year period.
By combining historical data from 2020–2026 with real-time scraping and analysis techniques, the study offers actionable intelligence for operational planning, competitive analysis, and expansion strategy. Stakeholders, including brand managers and franchise operators, can leverage these insights to optimize location planning, identify underserved markets, and monitor competitor activity effectively.
Tracking growth over the last six years reveals a steady increase in outlets. Using Scrape Pizza Hut Outlet Data India 2026, we observed that the number of stores grew from 400 in 2020 to over 850 in 2026, reflecting a CAGR of 13%.
The expansion is concentrated in urban and semi-urban clusters, with major metros like Mumbai, Delhi, Bangalore, and Hyderabad accounting for nearly 50% of the total outlets. Price benchmarking across these locations highlights a correlation between regional pricing strategies and outlet density.
Tables show city-wise growth trends and average revenue per outlet over 2020–2026. Smaller cities are showing faster growth rates, indicating potential for franchise expansion. Using automated scraping tools, we collected data on store openings, closures, and relocations, enabling a dynamic view of network expansion.
Price Benchmarking insights assist in understanding revenue potential per outlet and guide investment decisions for new store locations. This strategic approach allows brands to optimize operational efficiency while maximizing market penetration.
Ensuring accurate Pizza Hut Restaurant Listings Scraping India 2026 is essential for operational analytics and competitive intelligence. Our scraping process captured data from multiple sources, including official websites, third-party platforms, and online maps, covering all 850+ outlets.
Data included store name, location, type (dine-in, delivery, express), contact details, and regional clusters. Historical comparison from 2020 to 2026 allowed tracking of openings, closures, and relocations.
Tables detail outlet distribution by region, with metro cities showing 50% of stores and Tier 2/3 cities contributing 35%, highlighting growth opportunities in underserved areas. Accuracy of listings ensures reliable inputs for marketing campaigns, delivery route planning, and local promotions.
By consolidating data into a structured database, the client can monitor store presence, evaluate regional competition, and plan market interventions effectively. This methodology enables informed decision-making for new store launches, expansion feasibility studies, and operational optimization across India.
Using City-Wise Pizza Hut Locations Data Scraping India 2026, we mapped store density across India’s largest urban and semi-urban centers. Cities like Pune, Chennai, and Kolkata are experiencing a surge in new outlets, while smaller Tier 3 towns demonstrate untapped potential.
Brand penetration metrics show that the top 10 cities account for nearly 55% of total locations, while mid-tier cities are increasingly targeted for expansion. The analysis also integrates Brand Competition Analysis, comparing Pizza Hut with Domino’s, McDonald’s, and other QSR players, revealing competitive clusters and underserved markets.
Tables display city-wise outlet count, average distance between outlets, and population coverage for 2020–2026. This data helps in identifying saturation zones and strategic locations for future store openings, allowing for optimal resource allocation and franchise planning.
These insights enable the brand to design data-driven expansion strategies while maintaining market competitiveness.
Real-Time Pizza Hut Location Tracking India 2026 provides up-to-date visibility into outlet status, operational hours, and service types. Automated monitoring allows stakeholders to detect new store openings or closures within days rather than weeks.
Real-time analytics tracks metrics such as location density per city, delivery radius coverage, and regional outlet performance. This data helps identify areas where demand exceeds supply, enabling the brand to optimize delivery coverage and logistics.
Tables include outlet status, operational type, and real-time regional density from 2020–2026. Combined with historical trends, this approach allows the brand to proactively respond to competitor expansions and market shifts.
Real-time tracking supports operational efficiency, ensuring accurate customer-facing information across online platforms, aggregators, and mobile apps, while enhancing visibility into competitor presence for strategic decision-making.
Through Web Scraping Number of Pizza Hut Locations in India 2026, data was aggregated from multiple digital sources for comprehensive Product Data Tracking.
Our system collected historical and current outlet details, including location coordinates, store type, and opening dates. Integration with business intelligence dashboards enabled visual tracking of trends, competitor comparisons, and expansion hotspots.
Tables summarize total outlets by region, growth rate per year, and delivery coverage zones from 2020–2026. Data normalization ensured consistency across multiple platforms.
By combining scraped data with internal datasets, the client achieved a unified view of network expansion, enabling precise decision-making for franchise approvals, marketing campaigns, and logistics planning.
Using Pizza Hut Restaurant Listings Extraction India 2026, the client received structured datasets detailing store name, address, postal code, operational hours, and service type.
Historical trends from 2020–2026 reveal high-growth clusters and regions with potential saturation. Data tables show outlet counts, annual growth rates, and city-wise distribution, providing actionable intelligence for strategic planning.
This comprehensive dataset supports market analysis, competitor benchmarking, and targeted expansion initiatives, ensuring optimized operational and marketing decisions for the brand.
Actowiz Metrics leverages advanced data extraction and analytics to provide actionable insights for QSR brands. Our expertise in Pizza Hut Bestselling Food Analytics and Number of Pizza Hut Locations
Analytics in India 2026 enables brands to:
Our solutions integrate automated scraping, dashboards, and predictive insights, ensuring data-driven strategies for operational excellence and market leadership.
Through Food Analytics and Number of Pizza Hut Locations Analytics in India 2026, Actowiz Metrics delivered actionable insights that strengthened strategic planning, competitive benchmarking, and operational efficiency. Real-time and historical data provided a 360° view of outlet distribution and market trends.
Brands leveraging these insights can optimize expansion, improve delivery efficiency, and respond proactively to market changes.
Partner with Actowiz Metrics for comprehensive QSR analytics, real-time data tracking, and market intelligence solutions to drive growth and operational excellence!
Expert blogs, research reports and infographics — practical, data-driven reading across e-commerce and quick-commerce.
Most fields are optional — the more you share, the better your sample.


.webp "infographics")
.webp "infographics")


