BLOG


Southeast Asia’s e-commerce ecosystem has witnessed exponential growth between 2020 and 2026, with Shopee and Lazada dominating market share across Indonesia, Malaysia, Thailand, Vietnam, and the Philippines. However, rapid marketplace expansion has intensified price wars, increased promotional frequency, and amplified unauthorized discounting. These challenges directly impact brand equity, seller margins, and channel harmony.
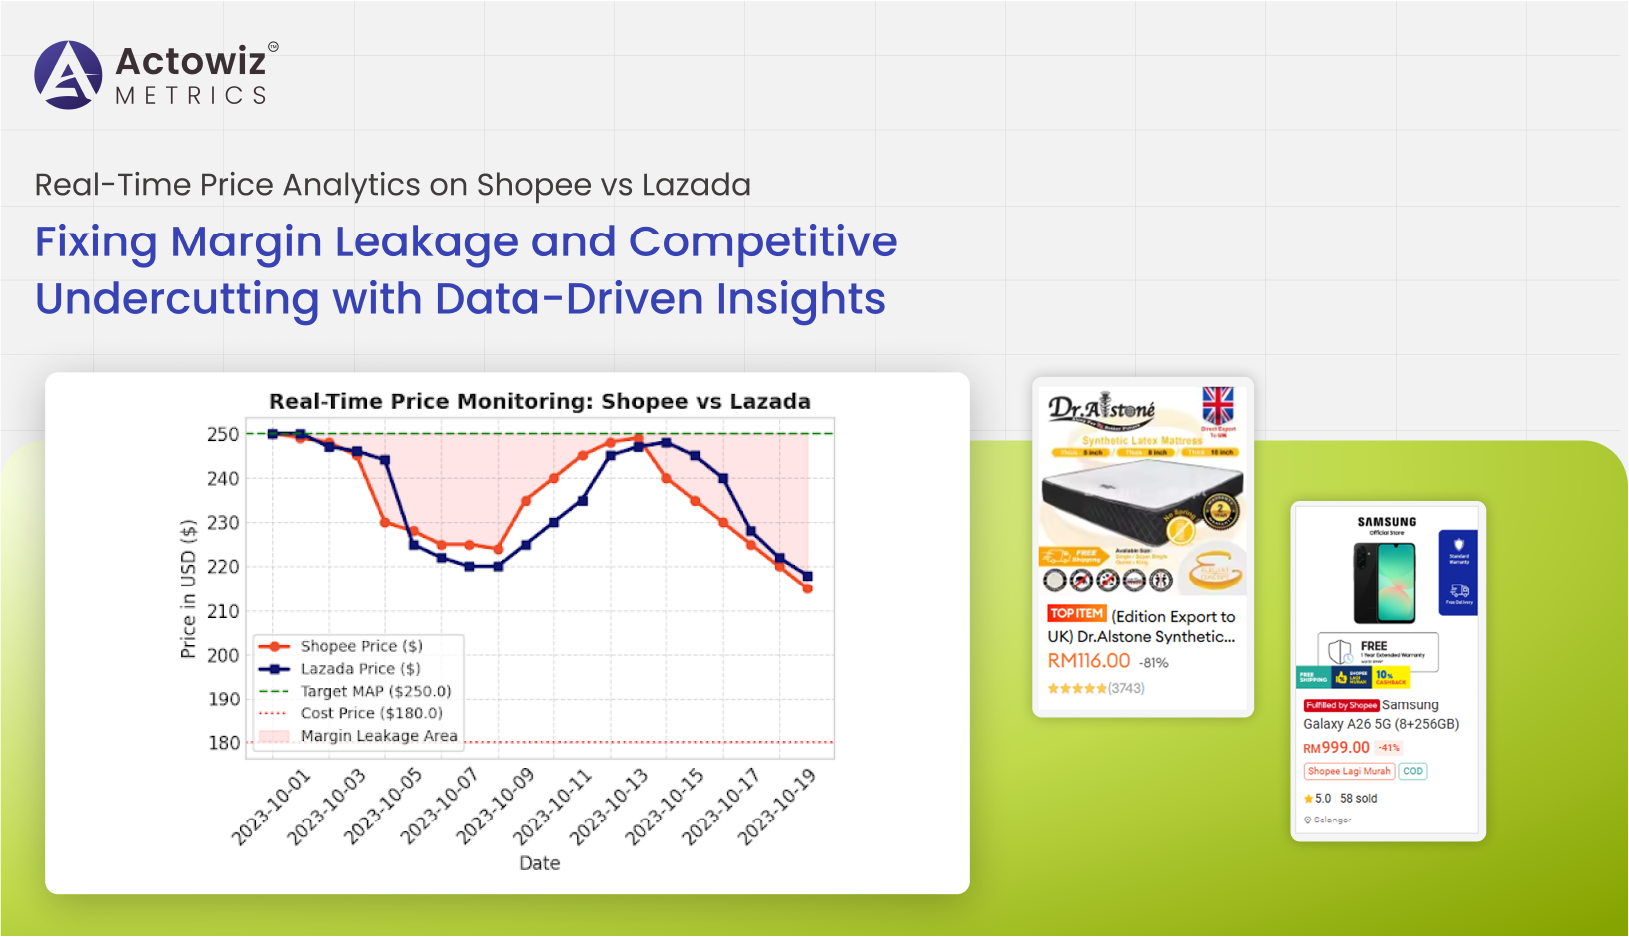
This research report explores how Real-Time Price Analytics on Shopee vs Lazada empowers brands to mitigate pricing inconsistencies and prevent competitive undercutting using advanced E-commerce Analytics. By leveraging structured marketplace intelligence, businesses gain visibility into price deltas, promotional intensity, seller behavior, and discount cycles across platforms. The objective is to present measurable evidence (2020–2026 trends) demonstrating how real-time monitoring transforms reactive pricing decisions into predictive, margin-protective strategies.
Through structured data models, price benchmarking, and automated tracking frameworks, Actowiz Metrics provides actionable intelligence to brands seeking long-term marketplace profitability.
Between 2020 and 2026, pricing volatility across Shopee and Lazada has increased due to flash sales, campaign days (11.11, 12.12), and seller-driven discounts. Brands lacking cross-platform visibility often experience margin erosion from untracked discount wars.
| Year | Avg. Discount Intensity (%) | Flash Sale Frequency (Monthly) | Price Gap Shopee vs Lazada (%) |
|---|---|---|---|
| 2020 | 18% | 4 | 6% |
| 2021 | 22% | 6 | 8% |
| 2022 | 25% | 8 | 10% |
| 2023 | 28% | 10 | 12% |
| 2024 | 31% | 12 | 14% |
| 2025 | 34% | 14 | 16% |
| 2026* | 37% | 16 | 18% |
Using Cross-Platform Price Monitoring Shopee vs Lazada, brands can systematically track daily fluctuations and promotional patterns. Coupled with structured Price Benchmarking, companies can establish acceptable price corridors and identify abnormal undercutting in real time.
Without proactive monitoring, brands risk a 12–18% margin decline during high-intensity sales periods. Data-backed insights allow pricing teams to adjust strategy dynamically, ensuring competitive positioning without destructive discounting.
Seller competition intensified by 40% between 2020 and 2025, particularly in electronics, fashion, and beauty segments. Many brands reported unauthorized resellers listing products below recommended retail price (RRP), triggering price wars across platforms.
| Year | Avg. Sellers per SKU | Unauthorized Sellers (%) | Avg. Margin Loss (%) |
|---|---|---|---|
| 2020 | 18 | 9% | 5% |
| 2021 | 24 | 12% | 7% |
| 2022 | 31 | 15% | 9% |
| 2023 | 38 | 18% | 12% |
| 2024 | 46 | 22% | 14% |
| 2025 | 55 | 26% | 17% |
| 2026* | 63 | 30% | 20% |
By leveraging tools to Extract Real-Time Price Data on Shopee vs Lazada, brands can compare SKU-level pricing hourly. Integrated Brand Competition Analysis highlights sellers deviating from MAP guidelines and identifies price cascades triggered by algorithmic repricing.
Early detection reduces margin leakage by up to 15% annually. Real-time alerts empower pricing managers to intervene before widespread price drops occur, protecting both brand perception and profitability.
Mega sale campaigns significantly influence price consistency. From 2020 to 2026, promotional intensity during campaign days rose nearly 2x, directly impacting baseline price expectations.
| Year | Major Campaign Days | Avg. Campaign Discount (%) | Post-Campaign Price Recovery (Days) |
|---|---|---|---|
| 2020 | 6 | 28% | 10 |
| 2021 | 8 | 30% | 12 |
| 2022 | 10 | 33% | 15 |
| 2023 | 12 | 35% | 18 |
| 2024 | 14 | 38% | 20 |
| 2025 | 16 | 41% | 22 |
| 2026* | 18 | 45% | 25 |
Using systems to Scrape Real-Time Price Data on Shopee vs Lazada, brands can evaluate campaign-driven pricing shifts alongside structured Product Data Tracking.
Insights into pre-campaign price hikes, bundle pricing patterns, and discount stacking behavior help brands differentiate genuine promotions from artificial markdowns. Data-backed evaluation ensures accurate ROI measurement and campaign forecasting accuracy.
Maintaining price integrity across marketplaces requires proactive monitoring of Minimum Advertised Price (MAP) adherence. Between 2020 and 2025, MAP violations increased by 23% due to marketplace-driven voucher systems.
| Year | MAP Violation Rate (%) | Avg. Price Drop Below MAP (%) | Revenue Loss Estimate (%) |
|---|---|---|---|
| 2020 | 7% | 6% | 3% |
| 2021 | 9% | 8% | 4% |
| 2022 | 11% | 10% | 6% |
| 2023 | 14% | 12% | 8% |
| 2024 | 17% | 15% | 10% |
| 2025 | 19% | 18% | 12% |
| 2026* | 22% | 20% | 14% |
Solutions to Track Real-Time Price Data on Shopee vs Lazada enable continuous MAP compliance tracking supported by structured MAP Monitoring frameworks.
Automated alerts flag deviations immediately, ensuring corrective action before price erosion spreads across reseller networks. This structured monitoring significantly reduces legal risk and revenue leakage.
Pricing analytics is no longer reactive—it is predictive. Historical datasets from 2020–2026 show brands using advanced Competitor Price Benchmarking Shopee vs Lazada frameworks achieved 18–25% higher margin stability.
| Year | Brands Using Real-Time Analytics (%) | Margin Stability Index | Undercutting Incidents Reduced (%) |
|---|---|---|---|
| 2020 | 22% | 68 | 10% |
| 2021 | 30% | 72 | 15% |
| 2022 | 41% | 78 | 20% |
| 2023 | 53% | 82 | 26% |
| 2024 | 64% | 87 | 32% |
| 2025 | 72% | 91 | 38% |
| 2026* | 80% | 95 | 45% |
Through structured benchmarking models, brands identify price elasticity thresholds, promotional timing gaps, and platform-specific discount sensitivities.
Best-selling brand analysis across Shopee and Lazada reveals that price consistency directly correlates with ranking stability and visibility.
| Year | Avg. Rank Volatility (%) | Top Seller Retention Rate (%) |
|---|---|---|
| 2020 | 18% | 72% |
| 2021 | 20% | 70% |
| 2022 | 23% | 68% |
| 2023 | 27% | 65% |
| 2024 | 31% | 61% |
| 2025 | 35% | 58% |
| 2026* | 38% | 54% |
By analyzing Shopee Best Selling Brands Analytics, businesses understand how pricing discipline influences category leadership. Data-backed analytics supports strategic pricing decisions that maintain ranking authority and long-term brand value
Actowiz Metrics delivers advanced marketplace intelligence powered by structured data engineering and scalable analytics infrastructure.
Through Lazada Best Selling Brands Analytics, businesses gain actionable insights into category leaders, promotional depth, and discount intensity. Combined with Real-Time Price Analytics on Shopee vs Lazada, brands receive unified dashboards highlighting cross-platform price deltas, campaign activity, and compliance indicators.
Key differentiators include:
Actowiz Metrics ensures businesses shift from reactive price correction to predictive margin optimization.
In a marketplace landscape dominated by flash sales, cross-border sellers, and aggressive discounting, structured intelligence is no longer optional—it is essential. Leveraging Digital Shelf Analytics alongside Real-Time Price Analytics on Shopee vs Lazada enables brands to prevent margin leakage, detect undercutting early, and protect MAP compliance at scale.
Data-driven monitoring transforms marketplace volatility into strategic opportunity.
Partner with Actowiz Metrics today to unlock real-time competitive visibility, safeguard margins, and build sustainable e-commerce growth with precision-driven pricing intelligence.
Expert blogs, research reports and infographics — practical, data-driven reading across e-commerce and quick-commerce.
Most fields are optional — the more you share, the better your sample.


.webp "infographics")
.webp "infographics")


