BLOG


The global fashion industry has rapidly evolved into a data-driven ecosystem where competitive advantage depends on actionable insights derived from Cross-Platform Fashion Data Analytics - SHEIN vs Temu vs Zara vs H&M. As digital-first brands and omnichannel retailers compete for market share, businesses rely heavily on E-commerce Analytics to monitor pricing strategies, consumer demand shifts, promotional patterns, and assortment dynamics.
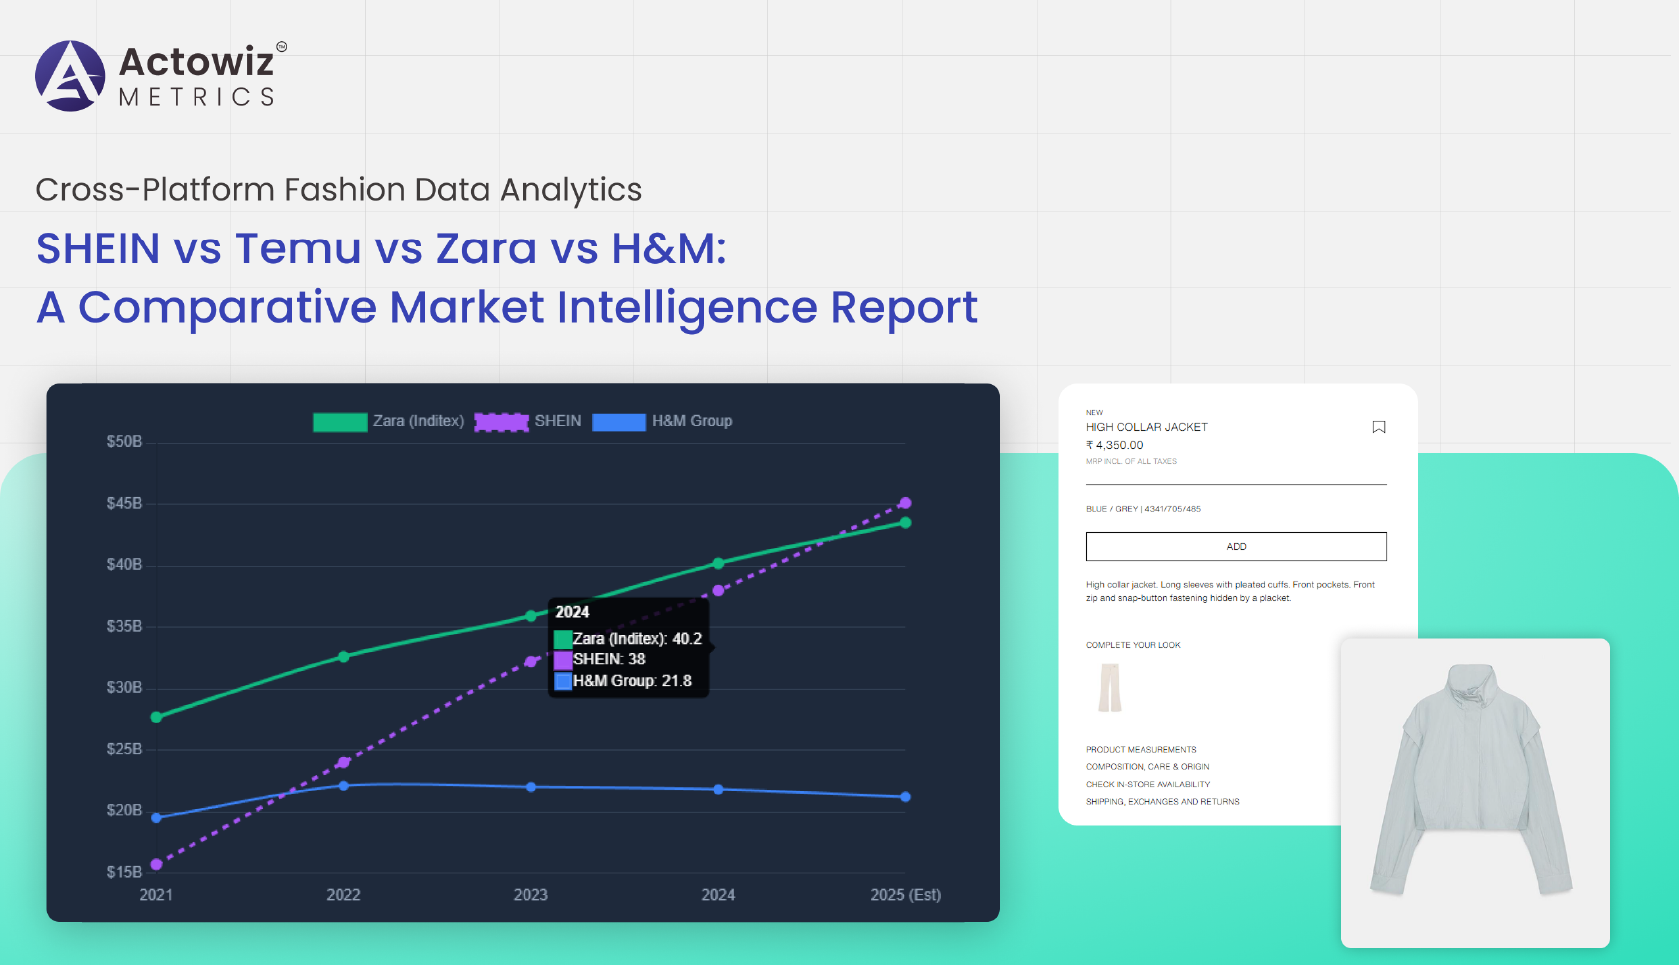
Between 2020 and 2026, global online fashion sales are projected to grow from $759 billion to over $1.4 trillion, driven by mobile commerce, influencer marketing, and AI-powered recommendations. SHEIN and Temu leverage ultra-fast supply chains and dynamic pricing, while Zara and H&M focus on omnichannel integration and sustainable fashion positioning.
For retailers, brands, and investors, understanding cross-platform price variance, discount intensity, stock turnover, and best-selling SKUs is critical. This report provides comparative intelligence across these four major fashion platforms using advanced analytics methodologies, enabling data-backed strategic decisions.
The rise of digital-native platforms has intensified reliance on Global Fashion E-commerce Data Analytics to decode consumer preferences and optimize inventory strategies. From 2020–2026, fashion marketplaces have increased SKU counts by 180%, while mobile purchases now account for 72% of total online fashion transactions.
Simultaneously, Digital Shelf Analytics plays a crucial role in understanding product visibility, ranking shifts, ratings, and search discoverability across platforms.
| Year | Global Online Fashion Revenue ($B) | Mobile Share (%) | Avg Discount Rate (%) |
|---|---|---|---|
| 2020 | 759 | 61 | 28 |
| 2021 | 820 | 64 | 30 |
| 2022 | 910 | 67 | 32 |
| 2023 | 1,020 | 69 | 34 |
| 2024 | 1,140 | 71 | 35 |
| 2025 | 1,280 | 72 | 36 |
| 2026* | 1,410 | 74 | 38 |
Platforms like SHEIN refresh thousands of SKUs daily, while Zara maintains controlled drop cycles. Temu focuses on aggressive discounting, and H&M balances trend-based and sustainable assortments.
Cross-platform analytics highlights that real-time product ranking fluctuations can shift sales performance by 20–35% within weeks. Data-backed assortment planning ensures brands remain competitive amid dynamic digital shelves.
Fashion platforms use aggressive discounting strategies to attract price-sensitive consumers. Fashion Price Monitoring - SHEIN vs Temu vs Zara vs H&M enables retailers to compare base prices, markdown cycles, and seasonal promotions across categories.
Additionally, Price Benchmarking ensures brands maintain margin stability while staying competitive.
| Year | SHEIN ($) | Temu ($) | Zara ($) | H&M ($) |
|---|---|---|---|---|
| 2020 | 12 | 11 | 38 | 28 |
| 2021 | 11 | 10 | 39 | 29 |
| 2022 | 10 | 9 | 40 | 30 |
| 2023 | 9 | 8 | 42 | 31 |
| 2024 | 9 | 8 | 44 | 32 |
| 2025 | 8 | 7 | 45 | 33 |
| 2026* | 8 | 7 | 46 | 34 |
SHEIN and Temu operate with ultra-low pricing models, while Zara and H&M maintain premium fast-fashion positioning. Data shows Temu discounts exceed 40% during promotional cycles, compared to 25% for Zara.
Retailers leveraging cross-platform monitoring reduce price mismatch risks by 18% and improve revenue optimization through dynamic repricing algorithms.
Detailed SHEIN vs Temu vs Zara vs H&M Fashion Price Comparison reveals strategic pricing segmentation. SHEIN targets impulse-driven purchases, Temu emphasizes flash deals, Zara focuses on trend leadership, and H&M balances affordability with sustainability.
| Category | SHEIN ($) | Temu ($) | Zara ($) | H&M ($) |
|---|---|---|---|---|
| Dresses | 14 | 12 | 59 | 42 |
| Tops | 9 | 8 | 39 | 28 |
| Denim | 18 | 16 | 69 | 49 |
| Outerwear | 25 | 22 | 110 | 79 |
Between 2020 and 2026, Zara’s premium pricing rose by 21%, while SHEIN reduced prices by 33% through supply-chain optimization.
Analytics shows conversion rates increase 25% when pricing aligns within ±5% of competitor averages. Price elasticity modeling across platforms allows brands to refine discount thresholds and margin strategies efficiently.
Retailers increasingly Scrape Fashion Product Prices, Discounts & Stock to capture real-time insights on competitor inventory and promotional velocity. This supports deeper Brand Competition Analysis, especially during seasonal peaks.
| Year | Avg Discount (%) | Out-of-Stock Rate (%) | SKU Growth (%) |
|---|---|---|---|
| 2020 | 28 | 9 | 15 |
| 2021 | 30 | 11 | 18 |
| 2022 | 32 | 13 | 22 |
| 2023 | 34 | 12 | 25 |
| 2024 | 35 | 10 | 28 |
| 2025 | 36 | 9 | 30 |
| 2026* | 38 | 8 | 33 |
SHEIN’s rapid replenishment reduces out-of-stock risk, while Temu’s flash-sale model causes short-term stock depletion spikes. Zara and H&M leverage centralized distribution for inventory balance.
Data scraping combined with AI forecasting reduces stockouts by 17% and enhances promotional ROI visibility across digital marketplaces.
SHEIN dominates fast-fashion categories with influencer-driven campaigns and hyper-responsive production cycles. Using SHEIN Best Selling Brands Analytics, brands track trending SKUs, customer ratings, and category growth momentum.
Integrated Product Data Tracking allows continuous monitoring of pricing updates, review sentiment, and inventory shifts.
| Year | Top SKU Avg Price ($) | Avg Rating | Review Growth (%) |
|---|---|---|---|
| 2020 | 13 | 4.1 | 18 |
| 2021 | 12 | 4.2 | 21 |
| 2022 | 11 | 4.3 | 25 |
| 2023 | 10 | 4.4 | 29 |
| 2024 | 10 | 4.5 | 32 |
| 2025 | 9 | 4.5 | 35 |
| 2026* | 9 | 4.6 | 38 |
Analytics shows top 10% of SKUs generate nearly 62% of SHEIN’s total online revenue. Real-time bestseller tracking helps competitors adapt assortment strategies swiftly.
Temu’s rapid growth stems from deep discounting and marketplace-driven competition. Leveraging Temu Best Selling Brands Analytics helps track trending private-label and third-party products.
Furthermore, MAP Monitoring ensures brands maintain minimum advertised pricing compliance across digital platforms.
| Year | Avg Discount (%) | Top SKU Sales Growth (%) | Marketplace Sellers (M) |
|---|---|---|---|
| 2020 | 35 | 20 | 0.5 |
| 2021 | 38 | 28 | 0.8 |
| 2022 | 40 | 34 | 1.2 |
| 2023 | 42 | 41 | 1.8 |
| 2024 | 44 | 48 | 2.5 |
| 2025 | 45 | 52 | 3.1 |
| 2026* | 47 | 58 | 3.8 |
Temu’s high discount structure accelerates acquisition but increases pricing volatility. MAP compliance analytics reduces unauthorized discount leakage by 15–20%.
Actowiz Metrics delivers advanced cross-platform intelligence solutions tailored for fashion retailers and brands. Through comprehensive dashboards, API integrations, and automated reporting, the company provides competitive insights across SHEIN, Temu, Zara, and H&M ecosystems.
With Zara Best Selling Brands Analytics, businesses can evaluate category growth, bestseller shifts, and digital shelf positioning in real time. Actowiz Metrics combines AI-powered predictive modeling, historical trend analysis (2020–2026), and granular SKU-level data extraction to ensure strategic clarity.
From pricing intelligence and inventory tracking to competitor benchmarking and MAP enforcement, Actowiz empowers brands to optimize revenue, improve margin control, and maintain market relevance.
Cross-platform analytics is no longer optional—it is essential for strategic growth in the competitive fashion ecosystem. Through detailed tracking of pricing, discounts, digital shelf positioning, and bestseller performance, brands gain measurable advantages across SHEIN, Temu, Zara, and H&M marketplaces.
Leveraging insights from H&M Best Selling Brands Analytics alongside cross-platform data intelligence enables retailers to refine assortment strategies and drive sustainable profitability.
Partner with Actowiz Metrics today to transform raw marketplace data into actionable fashion intelligence and unlock smarter retail decisions.
Expert blogs, research reports and infographics — practical, data-driven reading across e-commerce and quick-commerce.
Most fields are optional — the more you share, the better your sample.


.webp "infographics")
.webp "infographics")


