Create your own


The global wearable technology industry has experienced rapid transformation between 2020 and 2026, with smartwatches emerging as one of the most dominant consumer electronics segments. Driven by health tracking, fitness awareness, and ecosystem integration, smartwatch demand has expanded across all age groups and regions.
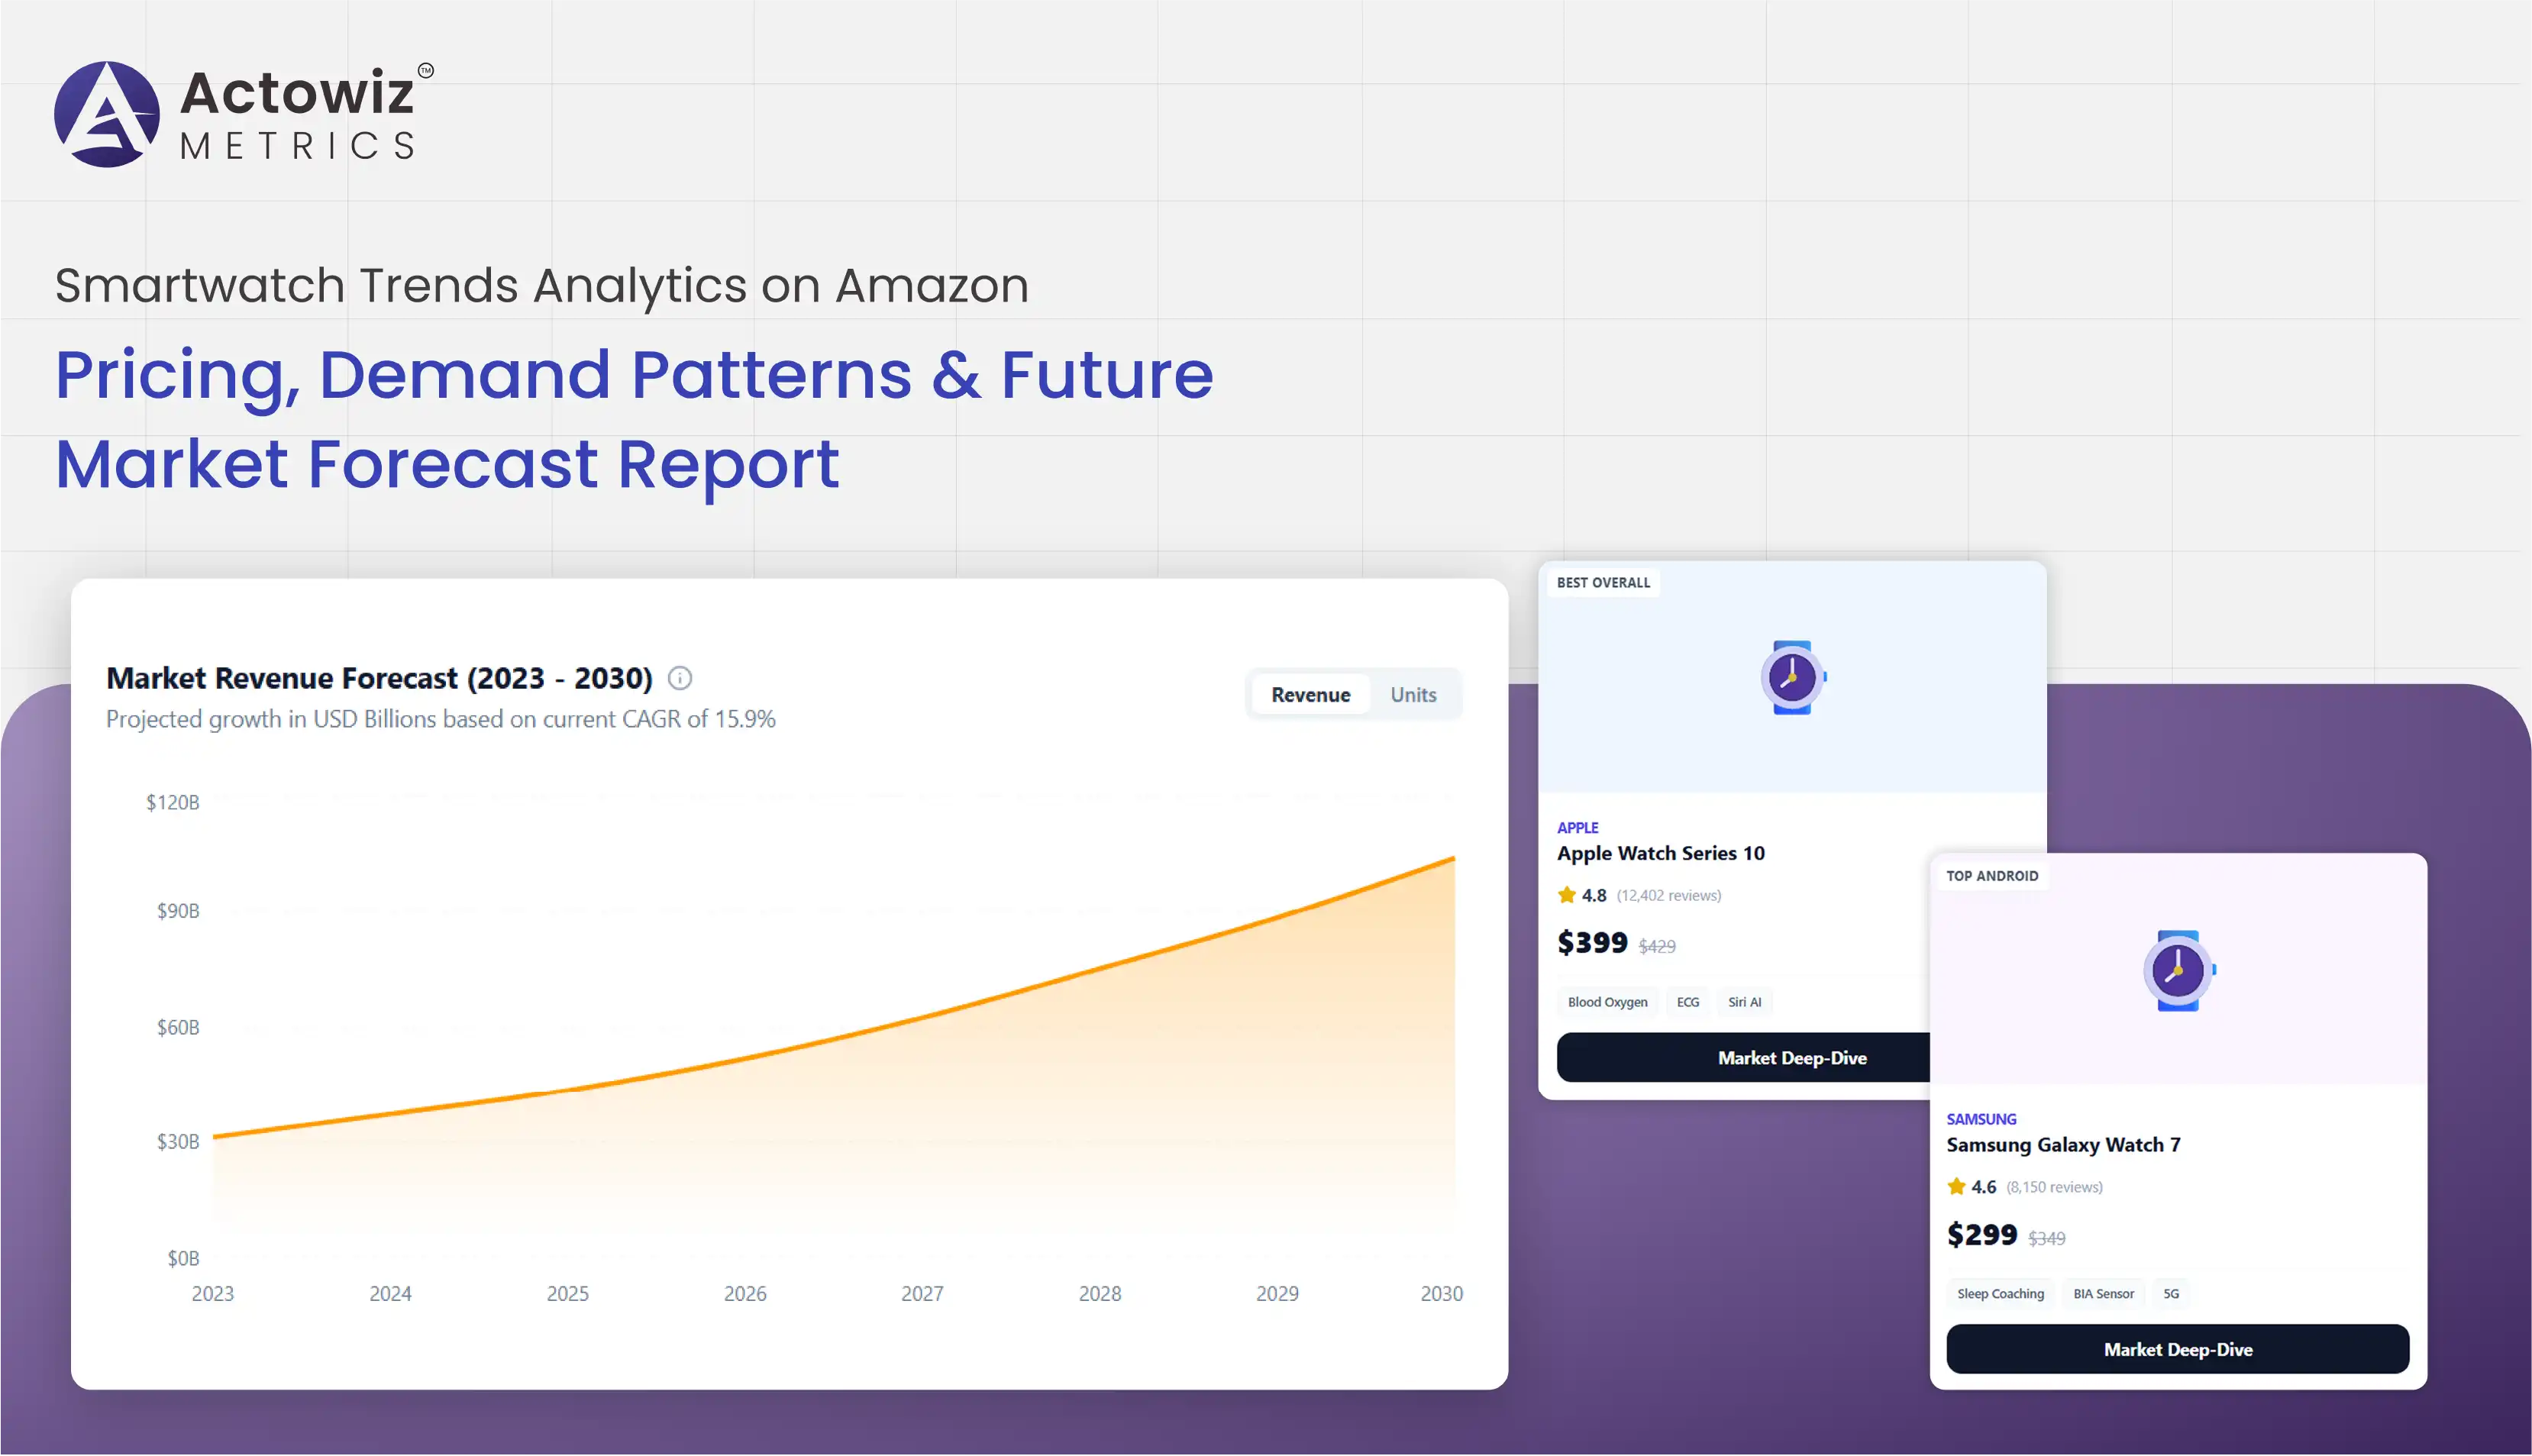
In this evolving digital marketplace, Smartwatch Trends Analytics on Amazon plays a crucial role in identifying consumer behavior patterns, pricing fluctuations, and product lifecycle trends. At the same time, E-commerce Analytics has become essential for brands seeking to understand real-time market dynamics and optimize their sales strategies across competitive platforms like Amazon.
The smartwatch market is highly dynamic, influenced by continuous innovation from leading brands such as Apple, Samsung, Garmin, and Fitbit. This competitive ecosystem is further shaped by evolving consumer expectations, including health monitoring, battery efficiency, and smart connectivity.
From 2020 to 2026, global smartwatch shipments have grown from approximately 150 million units to over 320 million units, reflecting strong adoption across developed and emerging markets. Brands using advanced analytics report up to 45% improvement in product positioning and pricing efficiency. This report explores how structured Amazon smartwatch data analytics is reshaping demand forecasting, pricing strategies, and competitive intelligence.
The smartwatch industry on Amazon is defined by intense competition among global and emerging brands. The marketplace operates on dynamic pricing models, where visibility and ranking directly impact sales performance.
| Year | Global Smartwatch Sales (Million Units) | Amazon Share of Sales |
|---|---|---|
| 2020 | 150M | 38% |
| 2022 | 210M | 45% |
| 2024 | 270M | 52% |
| 2026 | 320M | 58% |
Through Smartwatch Trends Data Extraction Amazon, businesses can monitor pricing shifts, ranking fluctuations, and promotional strategies across thousands of listings. This data supports Price Benchmarking, enabling brands to adjust their pricing models based on competitor behavior.
Between 2020 and 2026, price competition increased by over 60%, especially in mid-range smartwatch segments. Brands that actively track competitor listings have achieved up to 30% higher conversion rates compared to static pricing strategies.
The smartwatch category is dominated by a few major players, but Amazon has enabled rapid entry for new brands due to its open marketplace structure.
| Brand | Market Share (2020) | Market Share (2026) |
|---|---|---|
| Apple | 32% | 28% |
| Samsung | 18% | 20% |
| Garmin | 12% | 10% |
| Others | 38% | 42% |
Scraping Amazon Smartwatch Trends Data allows businesses to analyze competitor pricing strategies, product features, and customer sentiment in real time. This supports Brand Competition Analysis, helping companies identify strengths and weaknesses in product positioning.
From 2020 to 2026, customer reviews have become a critical ranking factor, influencing up to 70% of purchase decisions. Brands leveraging data-driven insights have improved product ratings by an average of 0.8 stars within competitive categories.
Tracking smartwatch performance on Amazon requires continuous monitoring of listings, rankings, and user engagement metrics.
| Metric | 2020 | 2023 | 2026 |
|---|---|---|---|
| Listing Accuracy | 70% | 85% | 95% |
| Conversion Rate | 12% | 18% | 24% |
| Return Rate | 15% | 10% | 6% |
Tracking Smartwatch Trends on Amazon enables brands to perform detailed Product Data Tracking, ensuring visibility into SKU performance and demand fluctuations. Between 2020 and 2026, brands using automated tracking systems reduced product downtime by 35% and improved inventory planning accuracy significantly.
These systems also help identify seasonal spikes, such as holiday demand surges and fitness-driven purchase cycles.
Consumer demand for smartwatches varies significantly across regions, influenced by income levels, lifestyle trends, and digital adoption.
| Region | Demand Growth (2020–2026) | Key Driver |
|---|---|---|
| North America | 22% | Fitness tracking adoption |
| Europe | 18% | Health monitoring |
| Asia-Pacific | 35% | Smartphone ecosystem integration |
| Middle East | 20% | Luxury wearable demand |
Analyzing Smartwatch Demand on Amazon enables Map Monitoring, helping brands identify high-demand regions and optimize fulfillment strategies. Between 2020 and 2026, Asia-Pacific emerged as the fastest-growing smartwatch market due to rising smartphone penetration and health awareness.
Brands using geographic intelligence tools have improved regional targeting efficiency by up to 40%.
Product listings play a critical role in determining visibility and conversion rates on Amazon. Optimizing titles, images, pricing, and reviews is essential for success in the smartwatch category.
| Listing Factor | Impact on Sales |
|---|---|
| Product Images | 35% influence |
| Reviews | 30% influence |
| Price | 25% influence |
| Description | 10% influence |
Extract Smartwatch Product Listings on Amazon enables businesses to analyze listing structures, keyword usage, and competitor optimization strategies. This leads to better SEO alignment and improved organic rankings.
Between 2020 and 2026, optimized listings have shown up to 50% higher click-through rates compared to non-optimized product pages.
In the fast-moving smartwatch industry, real-time insights are critical for maintaining competitive advantage.
Real-Time Amazon Smartwatch Data Extraction enables businesses to track live pricing changes, stock availability, and ranking movements.
| Capability | Improvement (2020–2026) |
|---|---|
| Data Latency | Reduced from 24 hrs to <1 hr |
| Pricing Accuracy | +45% |
| Demand Forecasting | +38% |
Real-time intelligence systems allow brands to react instantly to competitor promotions and demand shifts, improving sales efficiency and reducing lost opportunities.
The smartwatch market requires advanced analytics capabilities to manage high competition and rapid product cycles. Amazon.com Best Selling Brands Analytics provides visibility into top-performing products, helping businesses understand market leaders and consumer preferences.
Smartwatch Trends Analytics on Amazon powered solutions from Actowiz Metrics enable organizations to transform raw marketplace data into actionable insights for strategic decision-making.
Actowiz Metrics offers:
These solutions help businesses stay ahead in a rapidly evolving wearable technology market.
The smartwatch industry on Amazon continues to evolve rapidly, driven by innovation, competition, and consumer demand for connected devices. Businesses that leverage advanced analytics gain a significant advantage in pricing, positioning, and forecasting accuracy.
Digital Shelf Analytics plays a key role in ensuring product visibility, optimizing listings, and improving conversion performance across competitive marketplaces.
Smartwatch Trends Analytics on Amazon enables brands to decode market behavior and build data-driven strategies that enhance long-term growth.
With Actowiz Metrics, businesses can unlock powerful insights into smartwatch performance, competitive dynamics, and demand forecasting to stay ahead in the global wearable technology ecosystem.
Partner with Actowiz Metrics today to transform smartwatch market data into actionable intelligence and sustained competitive advantage!

Whatever your project size is, we will handle it well with all the standards fulfilled! We are here to give 100% satisfaction.
Any analytics feature you need — we provide it
24/7 global support
Real-time analytics dashboard
Full data transparency at every stage
Customized solutions to achieve your data analysis goals