BLOG
Create your own


In today’s hypercompetitive retail market, pricing, product availability, and consumer reviews have become critical decision-making levers. With shifting customer expectations, brands and retailers can no longer rely on guesswork. They need real-time, actionable insights into what competitors are doing across multiple platforms and regions. This is where Retail Competitor Analysis plays a pivotal role. By monitoring competitor pricing strategies, product assortment shifts, and customer feedback at scale, businesses can optimize their own offerings while ensuring long-term profitability.
Retailers increasingly rely on Web Scraping Services and advanced data-driven platforms to keep up with the constant price fluctuations and assortment variations in e-commerce. From the ability to Extract Competitor Products listing data to implementing Review and rating monitoring for retailers, competitive intelligence enables organizations to stay one step ahead. The retail battlefield is no longer about who sells more—it’s about who understands the market better.
As we analyze trends from 2020 to 2025, it becomes clear that Retail Competitor Analysis is more than just an operational necessity—it is a strategic tool that ensures competitive advantage, builds customer loyalty, and enhances profitability in both online and offline retail ecosystems.
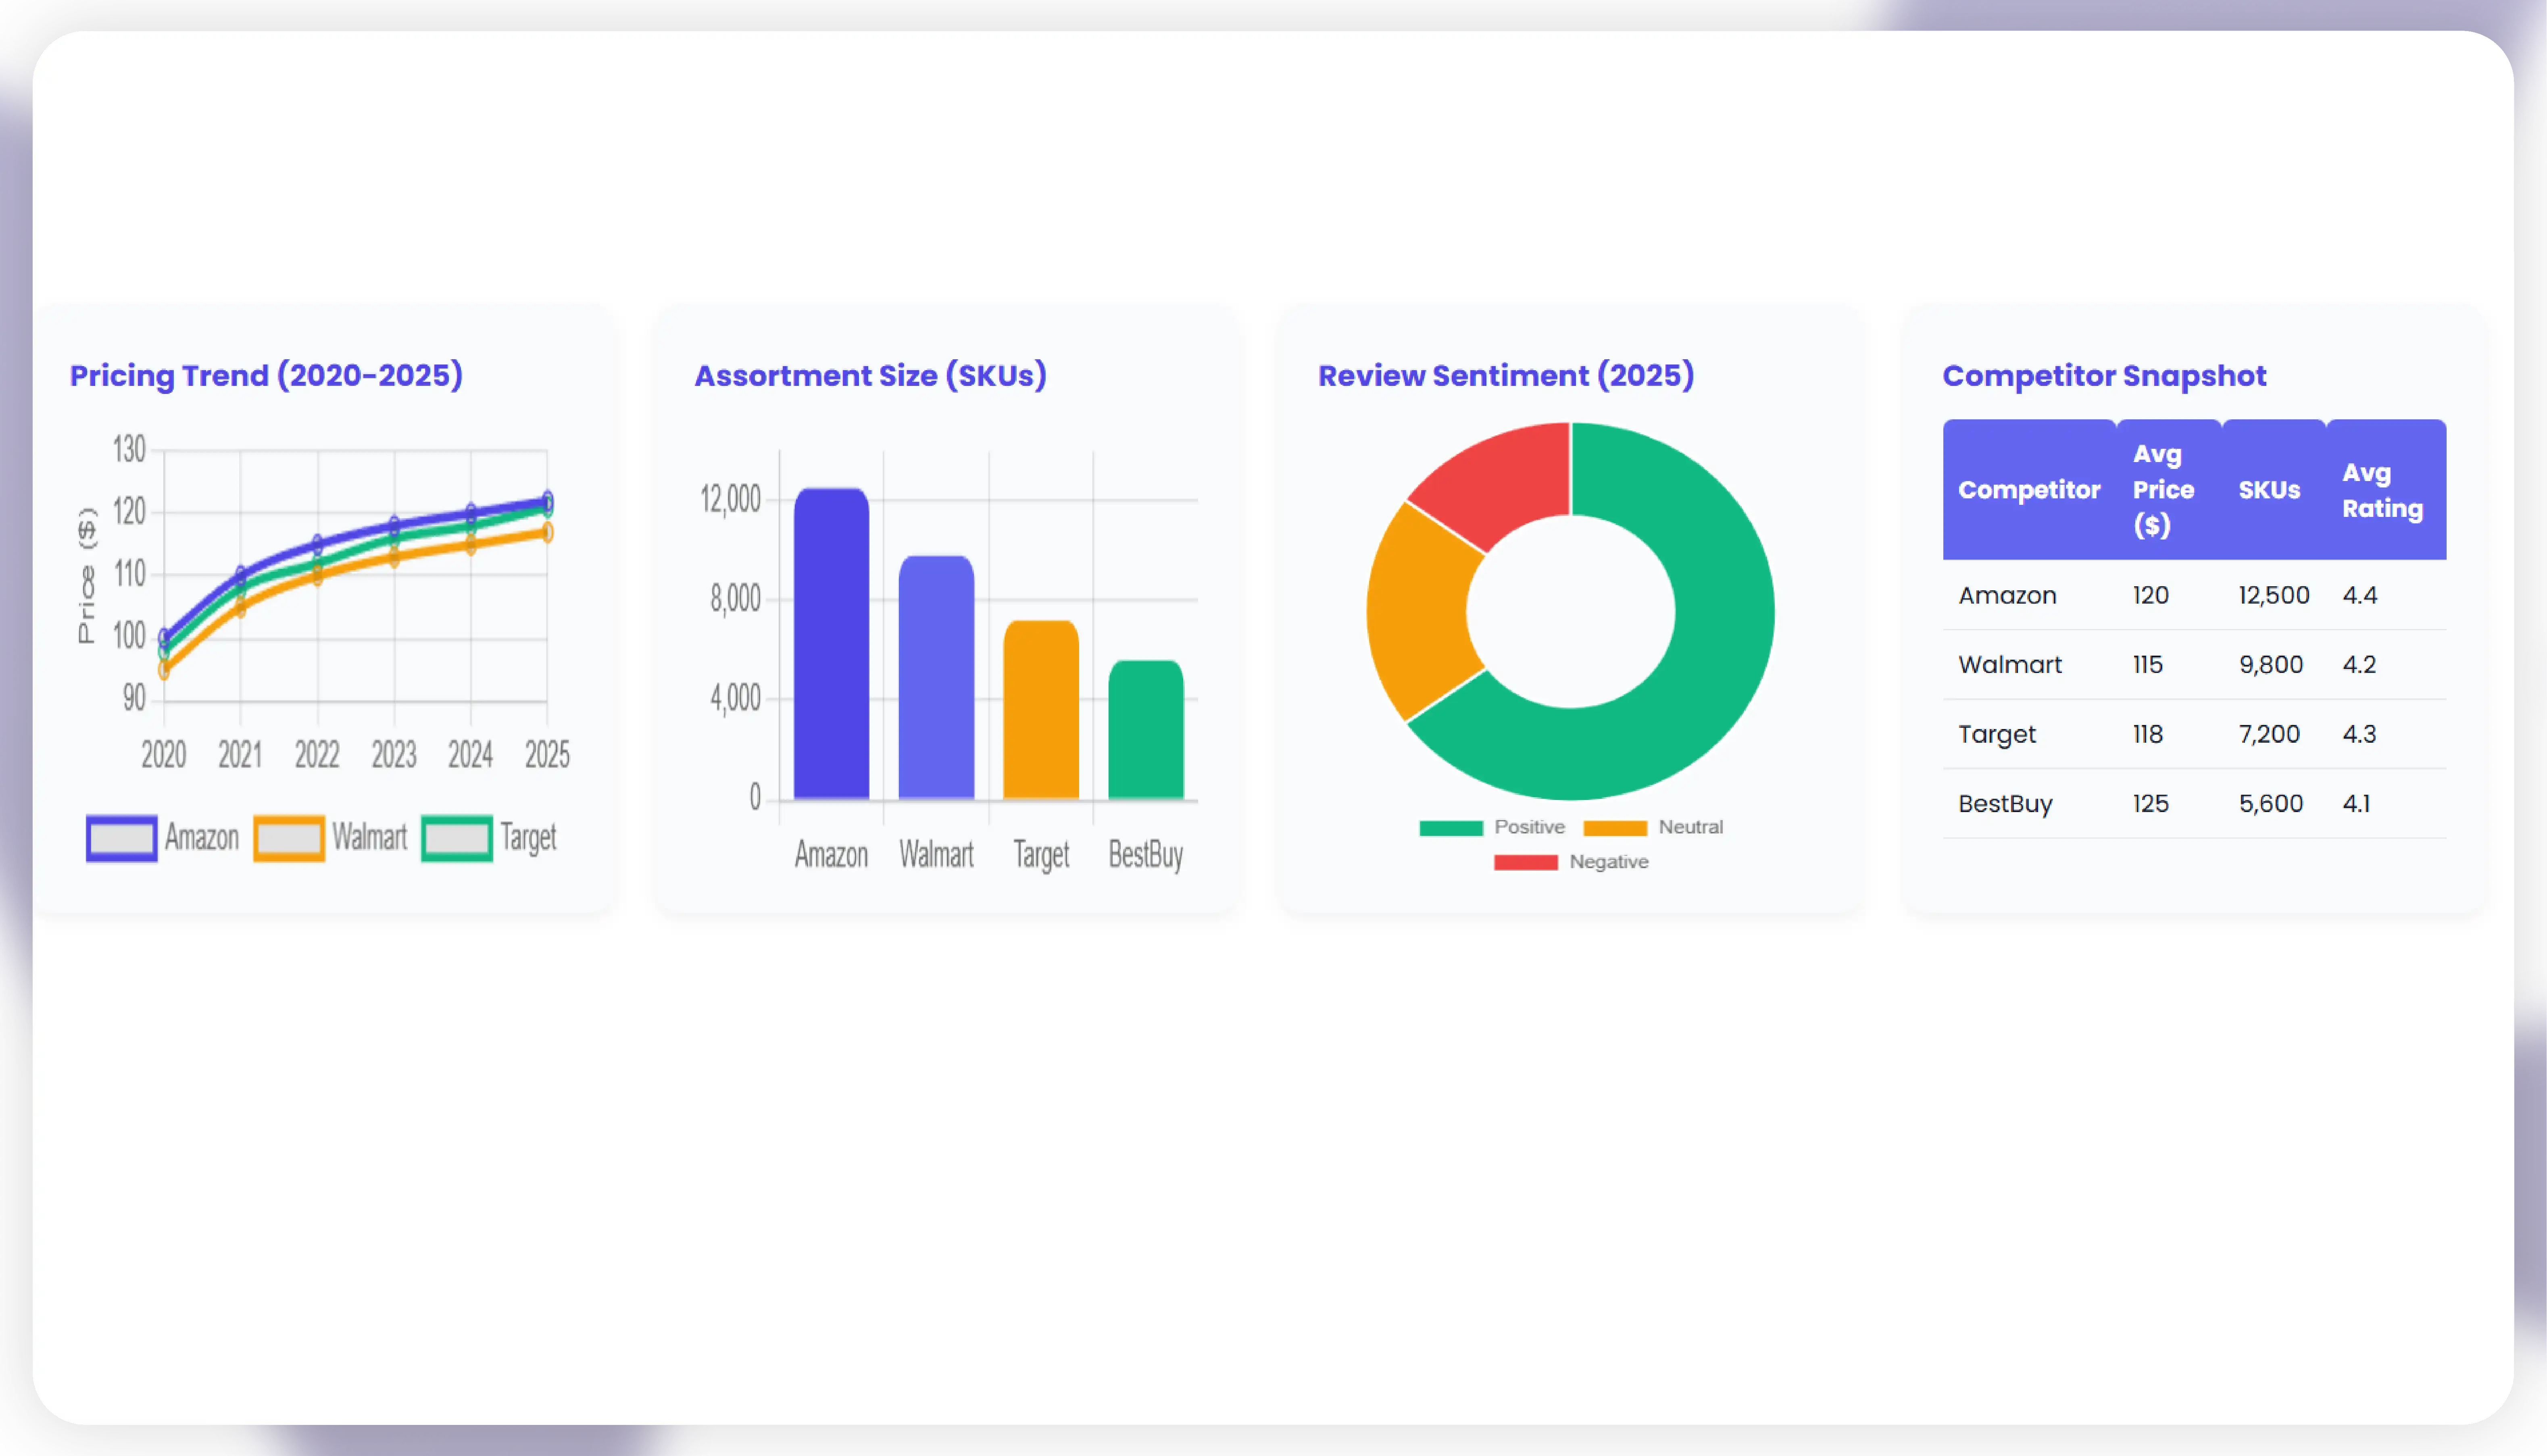
Price is one of the most influential drivers of consumer decision-making. Studies indicate that over 82% of shoppers compare prices across multiple platforms before making a purchase. By leveraging Track competitor prices and reviews, businesses can monitor real-time pricing shifts and understand how consumer feedback impacts brand perception.
For example, between 2020 and 2025, e-commerce giants like Amazon, Walmart, and Target adjusted pricing dynamically across categories such as electronics, apparel, and household goods. Retailers who failed to monitor these fluctuations struggled to maintain margins. Meanwhile, review monitoring helped brands understand emerging product flaws and adapt quickly.
| Year | Avg. Price Deviation (%) | Review Volume Growth (%) | Impact on Sales (%) |
|---|---|---|---|
| 2020 | 3.2% | 15% | -4% |
| 2021 | 4.1% | 22% | -6% |
| 2022 | 5.6% | 30% | -8% |
| 2023 | 6.3% | 38% | -9% |
| 2024 | 7.1% | 45% | -10% |
| 2025 | 8.4% | 52% | -12% |
The data shows a steady increase in both price deviations and review volume. Businesses adopting Retail Competitor Pricing Strategy analysis tools improved profit margins by up to 12% in categories like fashion and consumer electronics by 2025.
Assortment variety has a direct correlation with customer retention. Limited assortments push consumers to competitors, while oversaturated inventories often hurt profitability. Retailers must use Advanced assortment monitoring tools to balance consumer demand with optimal stock levels.
Between 2020 and 2025, the Korean and U.S. retail markets saw a rise in category diversification. Fashion brands, for instance, increased SKUs by 18% year-on-year to meet rising customer personalization needs. Retailers with advanced Retail Competitor Analysis platforms successfully matched assortment trends while maintaining profitability.
| Year | Avg. SKU Growth (%) | Customer Retention (%) | Retailer Margin Impact (%) |
|---|---|---|---|
| 2020 | 5% | 65% | -2% |
| 2021 | 8% | 68% | -1% |
| 2022 | 11% | 72% | +1% |
| 2023 | 14% | 75% | +2% |
| 2024 | 16% | 78% | +3% |
| 2025 | 18% | 81% | +5% |
The findings underline that optimized assortment tracking improves both retention and margins. Retailers adopting Extract Competitor Products listing data from platforms like Amazon, Flipkart, and eBay saw higher efficiency in demand forecasting.
In the omnichannel era, shoppers browse across multiple platforms before making a purchase. With Cross-platform retail data analysis, retailers can capture insights into product availability, discounts, and customer sentiments across marketplaces, social commerce, and direct-to-consumer websites.
From 2020 to 2025, mobile-driven shopping surged by 47%, with platforms like Instagram Shopping and TikTok Shop gaining ground. Retailers tracking competitors across these platforms optimized promotions and launched limited-edition products that aligned with consumer expectations.
| Year | Avg. Online Platforms Used by Consumers | Retailers Using Cross-Platform Analytics (%) | Sales Uplift from Cross-Channel (%) |
|---|---|---|---|
| 2020 | 1.8 | 32% | 4% |
| 2021 | 2.1 | 38% | 6% |
| 2022 | 2.6 | 45% | 8% |
| 2023 | 3.2 | 52% | 11% |
| 2024 | 3.9 | 61% | 14% |
| 2025 | 4.4 | 72% | 18% |
Adoption of Omnichannel competitor analysis tools drove consistent growth, enabling retailers to adjust to regional differences and capture a wider audience.
Decision-makers need real-time, consolidated insights. A Data-driven Competitor Analysis dashboard integrates pricing, assortment, and review data into a single view. Between 2020 and 2025, adoption of AI dashboards increased by 60%.
Retailers with access to such dashboards achieved faster decision-making and stronger agility in responding to competitor promotions. For example, companies using Scrape Retail pricing trends data reduced pricing reaction time from 3 days to less than 12 hours.
| Year | Retailers Using Dashboards (%) | Avg. Pricing Adjustment Speed | Sales Growth (%) |
|---|---|---|---|
| 2020 | 28% | 3 days | 3% |
| 2021 | 35% | 2.2 days | 4% |
| 2022 | 44% | 1.8 days | 6% |
| 2023 | 52% | 1.2 days | 8% |
| 2024 | 61% | 18 hours | 11% |
| 2025 | 72% | 12 hours | 14% |
These insights reflect how AI-enhanced dashboards transformed operational responsiveness, delivering measurable ROI in competitive markets.
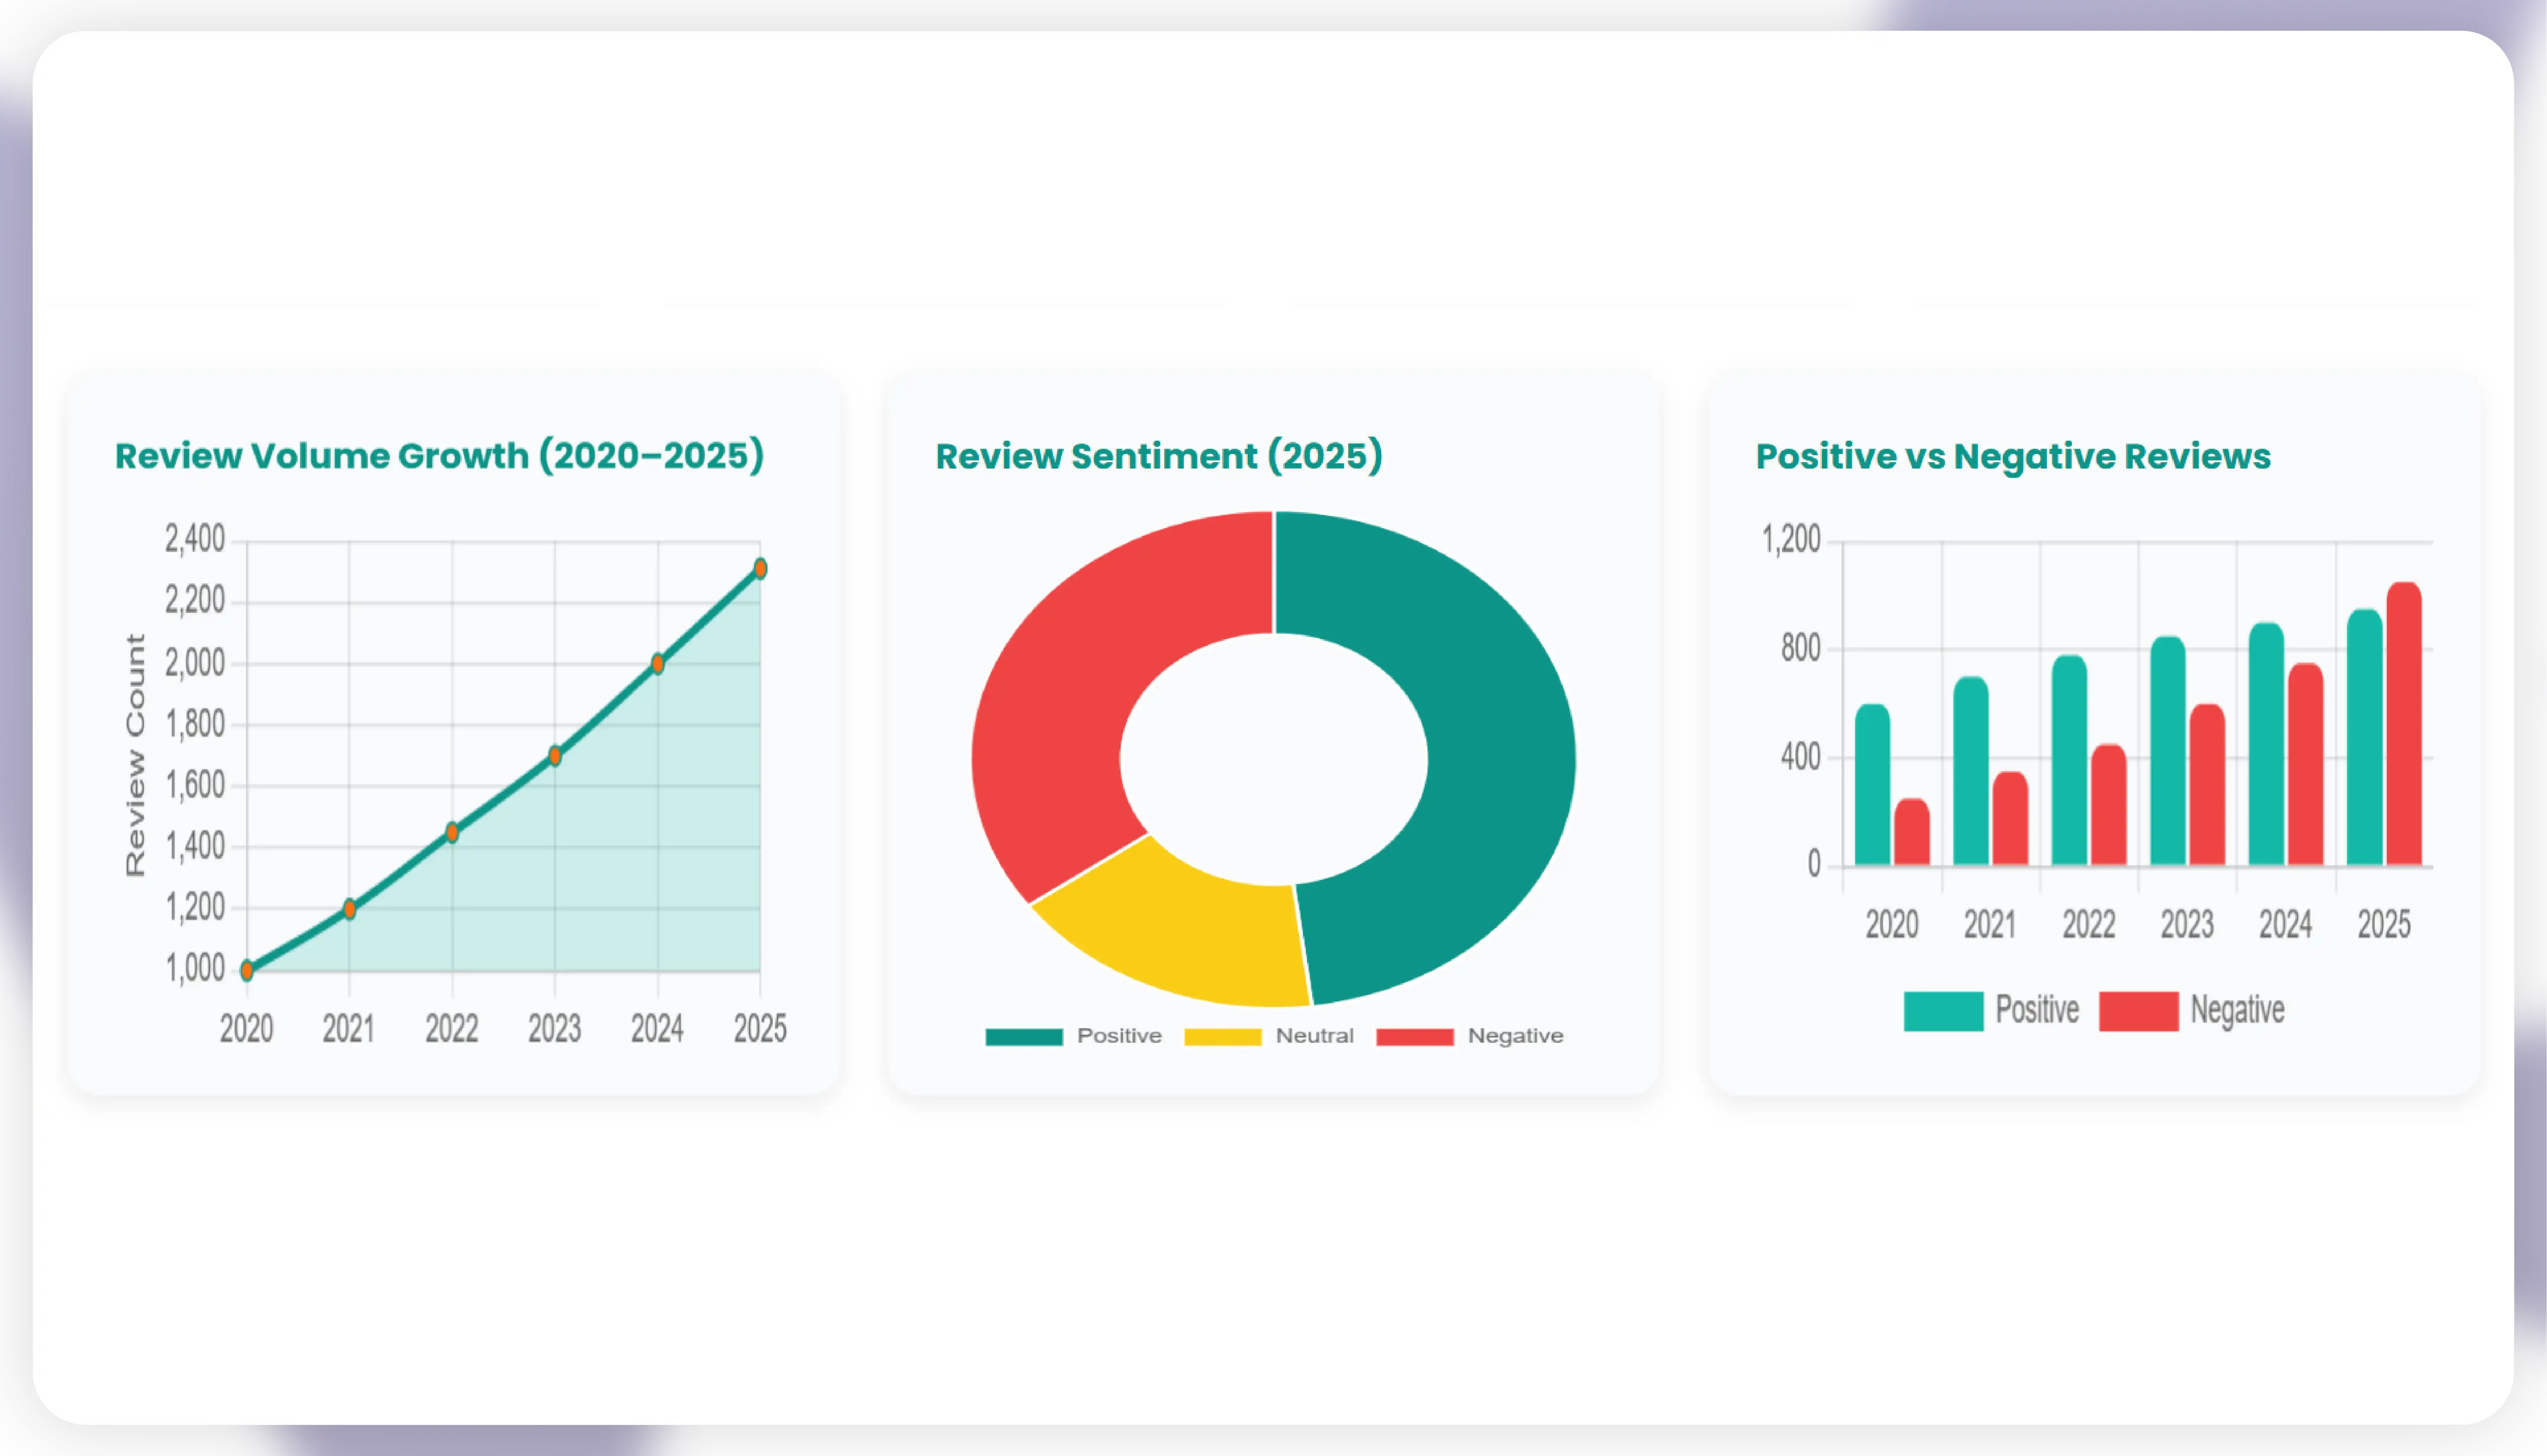
Reviews directly influence purchase decisions. Retailers leveraging Review and rating monitoring for retailers gained deeper insight into consumer satisfaction. Between 2020–2025, online review volume rose by 52%, with negative reviews growing faster than positive due to increasing customer expectations.
| Year | Total Review Volume Growth (%) | Negative Review Share (%) | Revenue Impact of Negative Reviews (%) |
|---|---|---|---|
| 2020 | 15% | 21% | -2% |
| 2021 | 22% | 24% | -3% |
| 2022 | 30% | 27% | -5% |
| 2023 | 38% | 29% | -7% |
| 2024 | 45% | 32% | -8% |
| 2025 | 52% | 35% | -10% |
Retailers with proactive monitoring were able to engage customers faster, reducing churn. The integration of AI Web Scraping Market solutions enabled scalable collection of reviews across categories, giving businesses a complete view of sentiment dynamics.
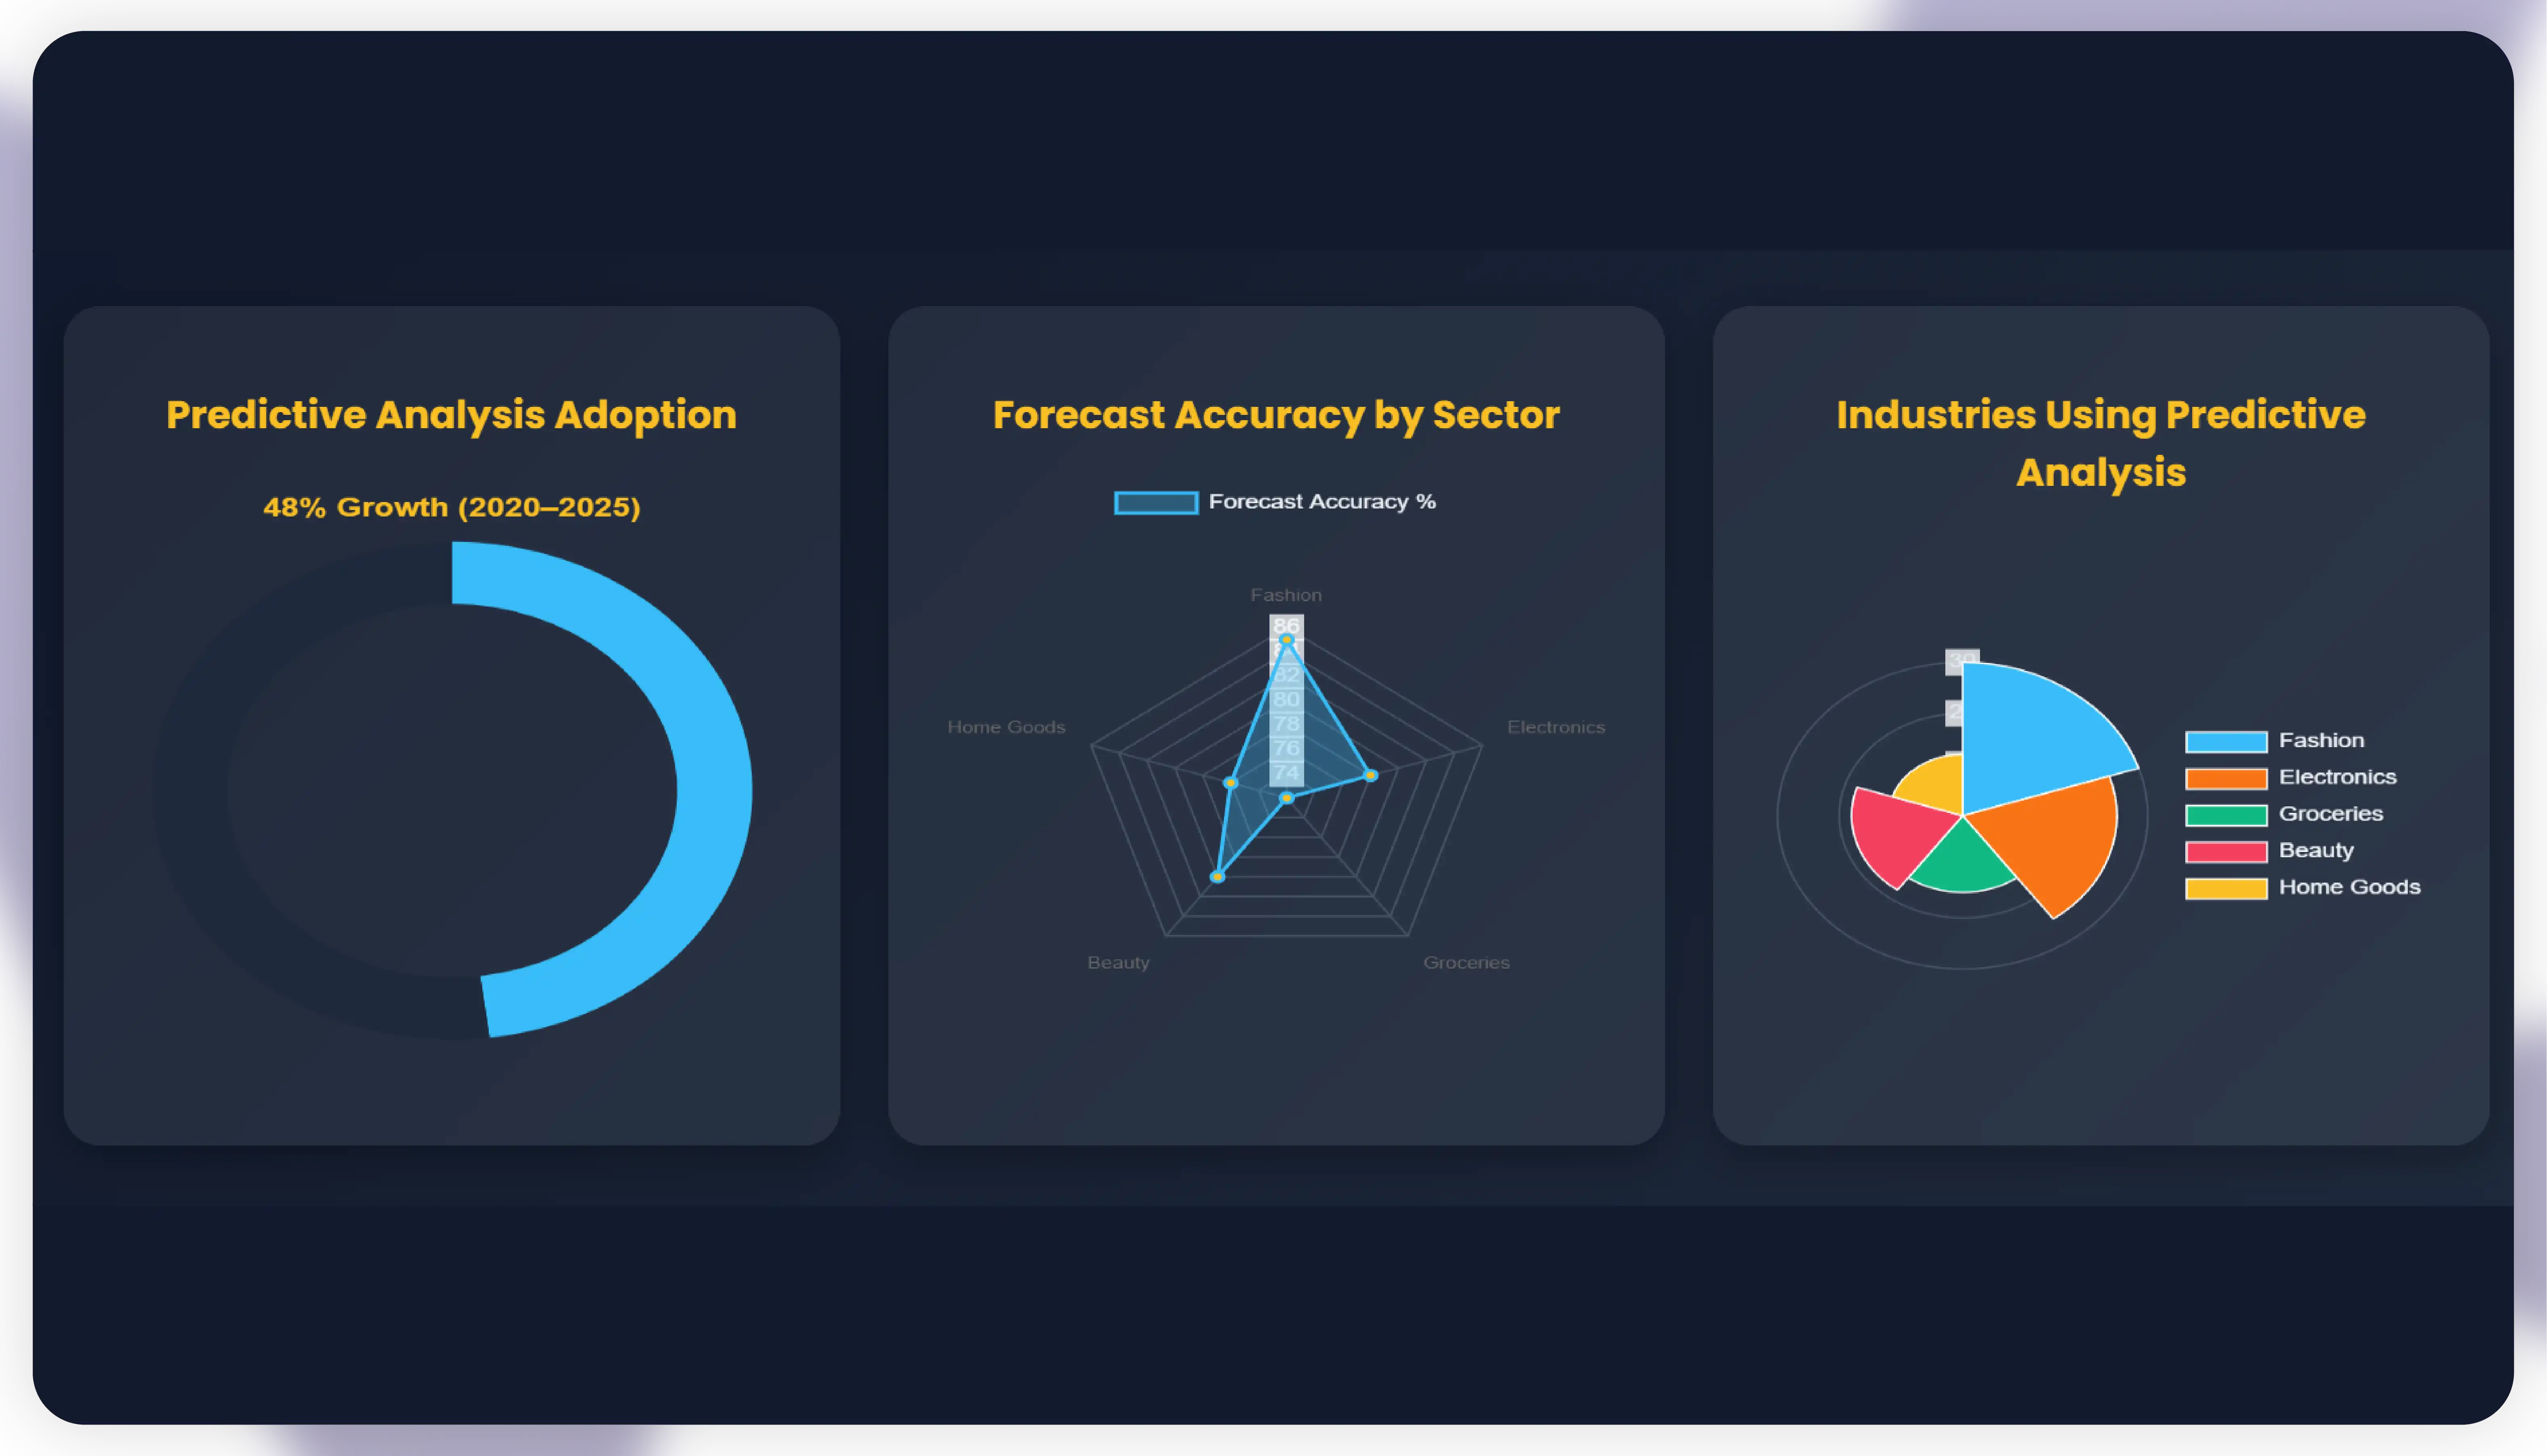
The future lies in predictive capabilities. With AI Web Crawling Market Analysis and AI-Powered Data Extraction Insights, retailers can not only monitor but also forecast competitor moves. Between 2020 and 2025, adoption of predictive competitor analysis grew by 48%.
| Year | Retailers Using Predictive Analytics (%) | Forecast Accuracy (%) | Revenue Growth (%) |
|---|---|---|---|
| 2020 | 18% | 63% | 2% |
| 2021 | 24% | 68% | 4% |
| 2022 | 31% | 72% | 6% |
| 2023 | 39% | 76% | 8% |
| 2024 | 47% | 81% | 11% |
| 2025 | 53% | 85% | 14% |
By combining AI-powered web data extraction with Future trends in AI web scraping technology, retailers can proactively prepare for pricing wars, inventory shifts, and customer sentiment swings.
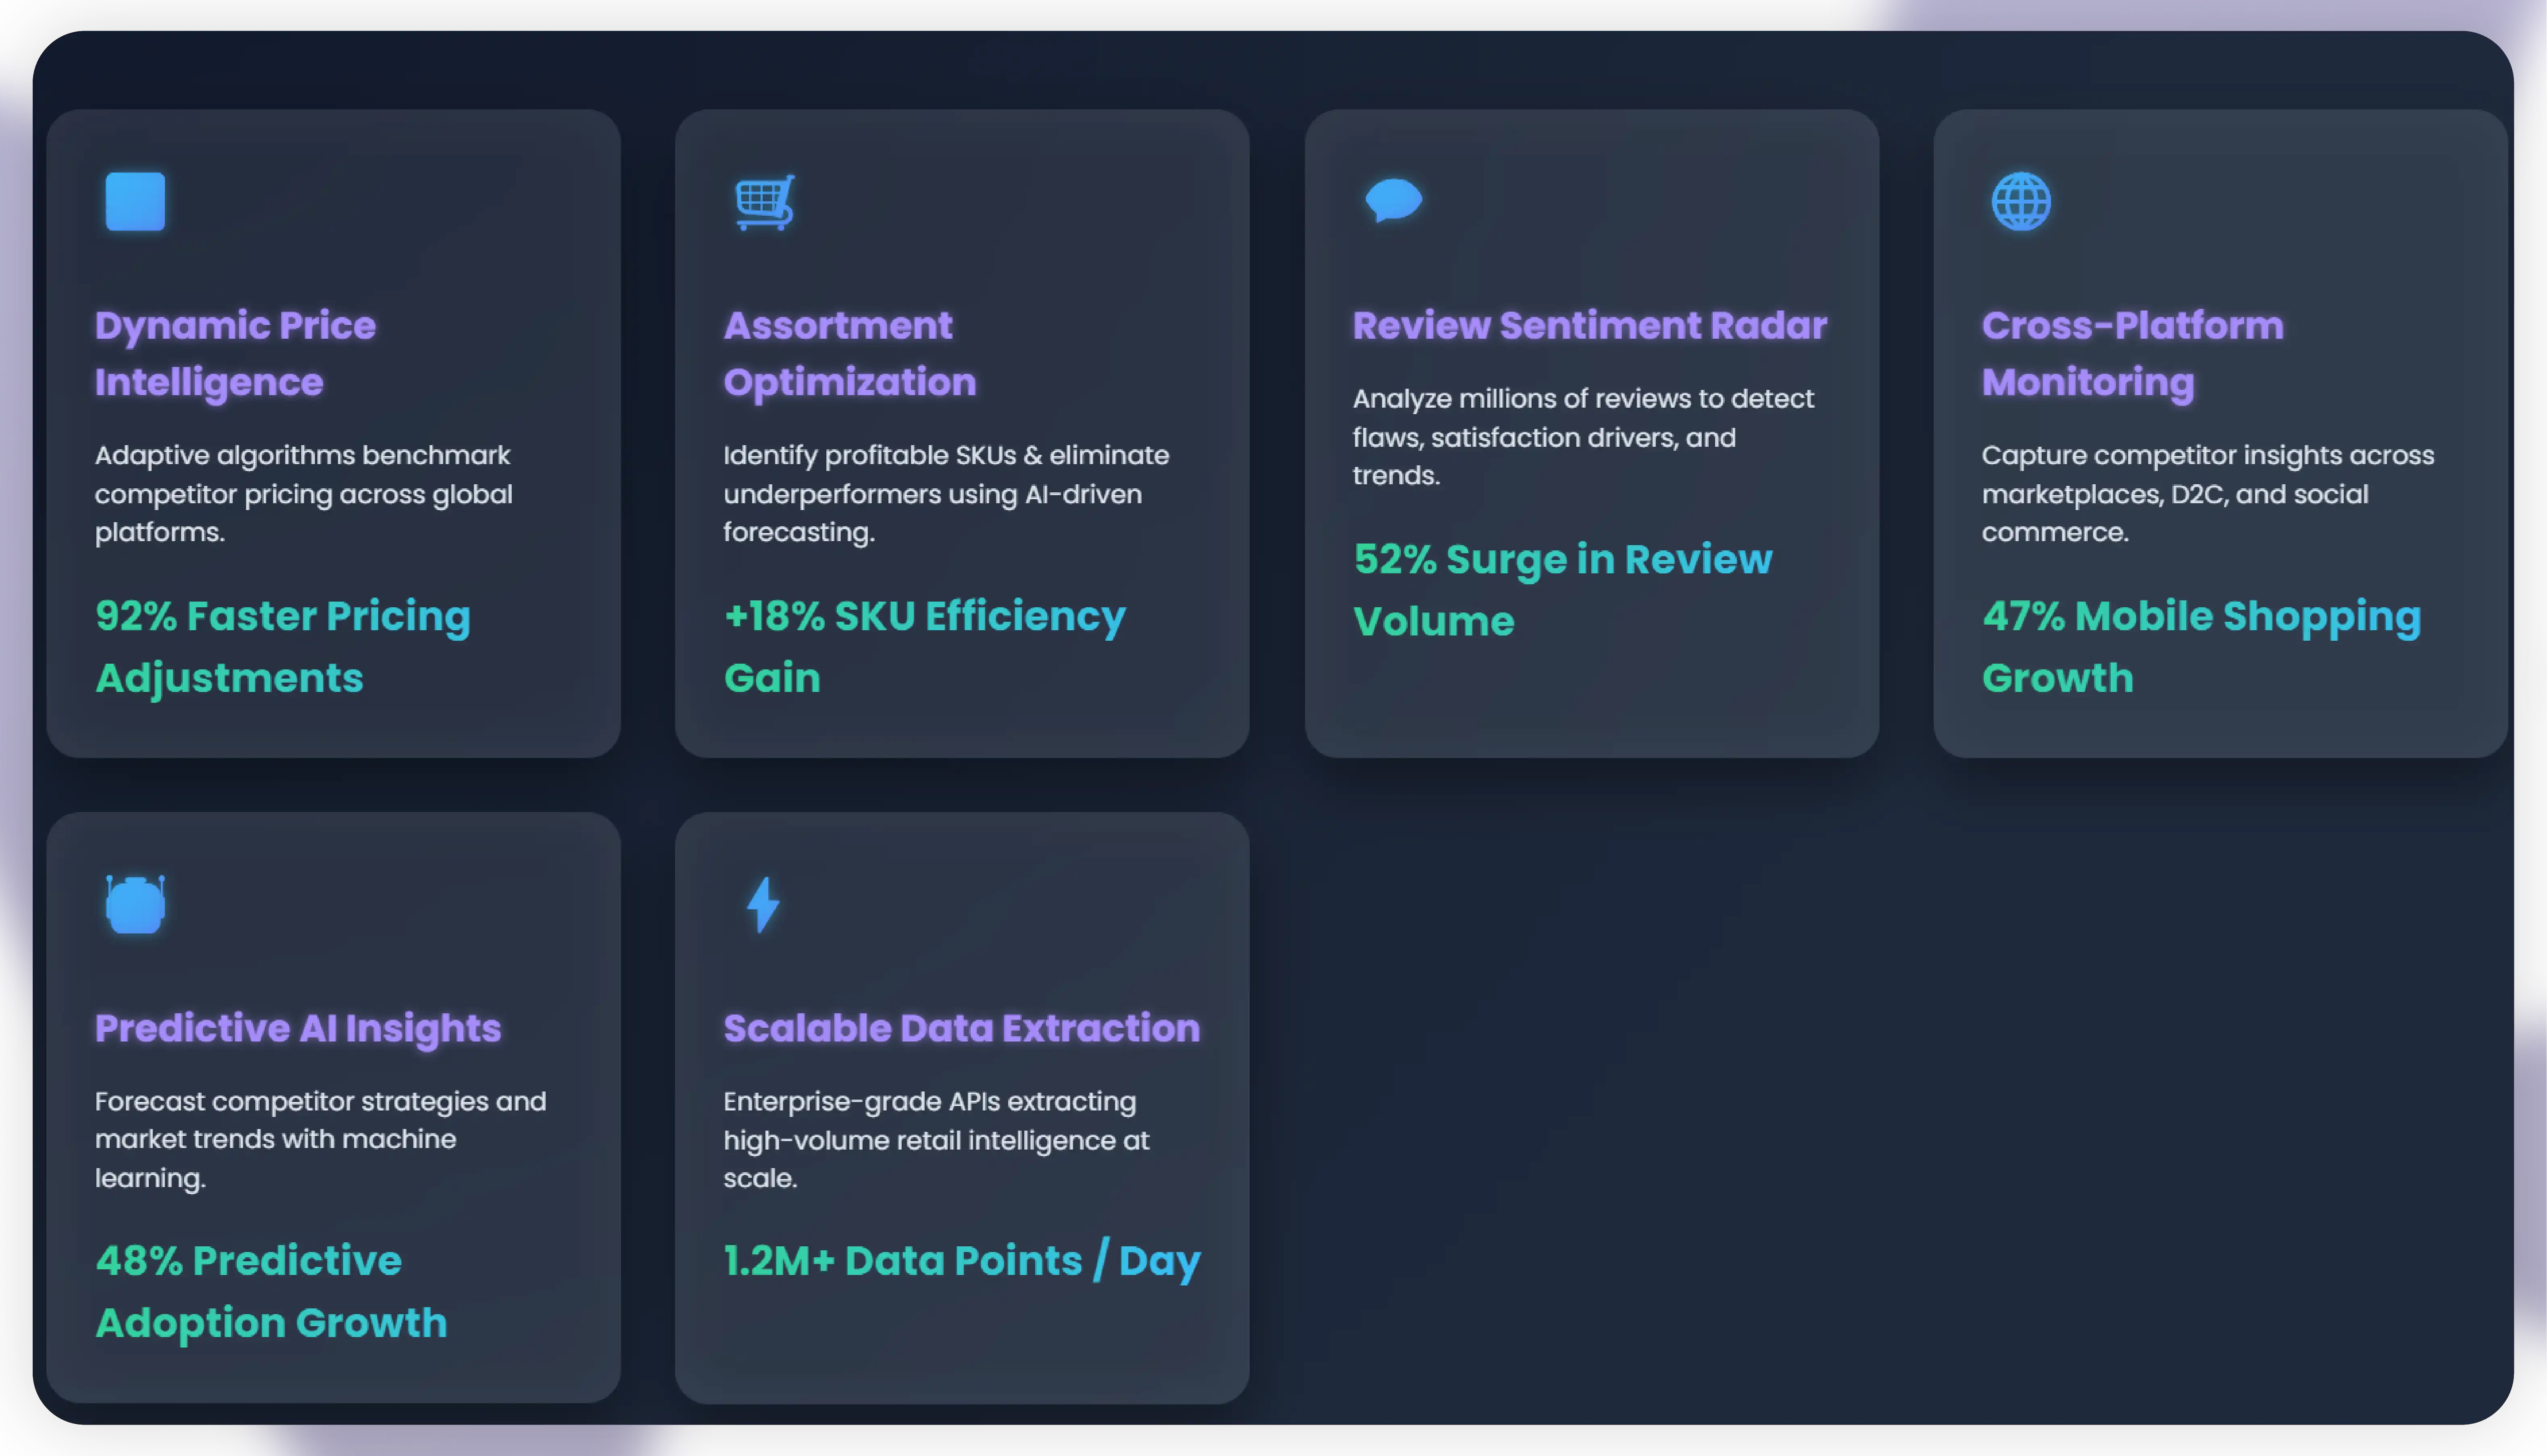
Actowiz Metrics specializes in delivering comprehensive retail intelligence through scalable Web Scraping API Services and customized data platforms. By leveraging AI-Powered Web Scraping, Actowiz enables retailers to track competitors in real time, extract actionable insights, and visualize key metrics through user-friendly dashboards.
Our expertise in Ecommerce Data Analytics, Price Intelligence AI, and Retailer Intelligence empowers businesses to monitor not only price shifts but also assortment gaps, customer reviews, and omnichannel dynamics. With advanced capabilities to Scrape Retail pricing trends data, clients benefit from reduced reaction times, better forecasting, and improved customer satisfaction.
Whether it’s monitoring competitor promotions across multiple platforms, performing Web Scraping Services at scale, or providing predictive retail analytics, Actowiz Metrics ensures you have the competitive edge to thrive in an evolving marketplace.
The retail ecosystem is undergoing unprecedented transformation. With increased competition, rising customer expectations, and rapid technological change, businesses that ignore competitor insights risk falling behind. Retail Competitor Analysis is no longer optional—it is the foundation of sustainable growth. By monitoring price, assortment, and reviews through modern tools and platforms, retailers can identify market gaps, optimize strategies, and enhance profitability.
Between 2020 and 2025, the data has consistently proven that businesses embracing competitive intelligence outperformed those who relied on outdated practices. Retailers leveraging Data-driven Competitor Analysis dashboards and Omnichannel competitor analysis tools reported faster adaptation, stronger customer loyalty, and higher profit margins.
Actowiz Metrics is here to help you stay ahead of the curve with tailored retail intelligence, predictive insights, and real-time competitor monitoring. Ready to transform your retail strategy with powerful competitive insights? Contact Actowiz Metrics today and unlock the future of data-driven retail excellence.
Expert blogs, research reports and infographics — practical, data-driven reading across e-commerce and quick-commerce.
Most fields are optional — the more you share, the better your sample.


.webp "infographics")
.webp "infographics")


