BLOG


In an era where data fuels competitive advantage, businesses can no longer rely solely on aggregated national datasets for decision-making. While national market intelligence paints a big-picture view, it often conceals micro-trends, local competitive pricing tactics, and consumer behavior differences that could make or break profitability.
The United States is especially challenging because of its economic, cultural, and demographic diversity. Factors such as regional cost-of-living variations, state-specific regulations, and seasonal demand shifts mean that a one-size-fits-all strategy will often underperform.
Actowiz Metrics helps companies bridge this knowledge gap by providing geographic data collection for business intelligence, which includes:
By combining both regional and national data insights, companies gain a complete picture of market conditions, enabling them to make better-informed strategic, operational, and pricing decisions.
To understand why regional vs national data collection is critical, let’s explore the three key dimensions of business impact in the U.S. market.
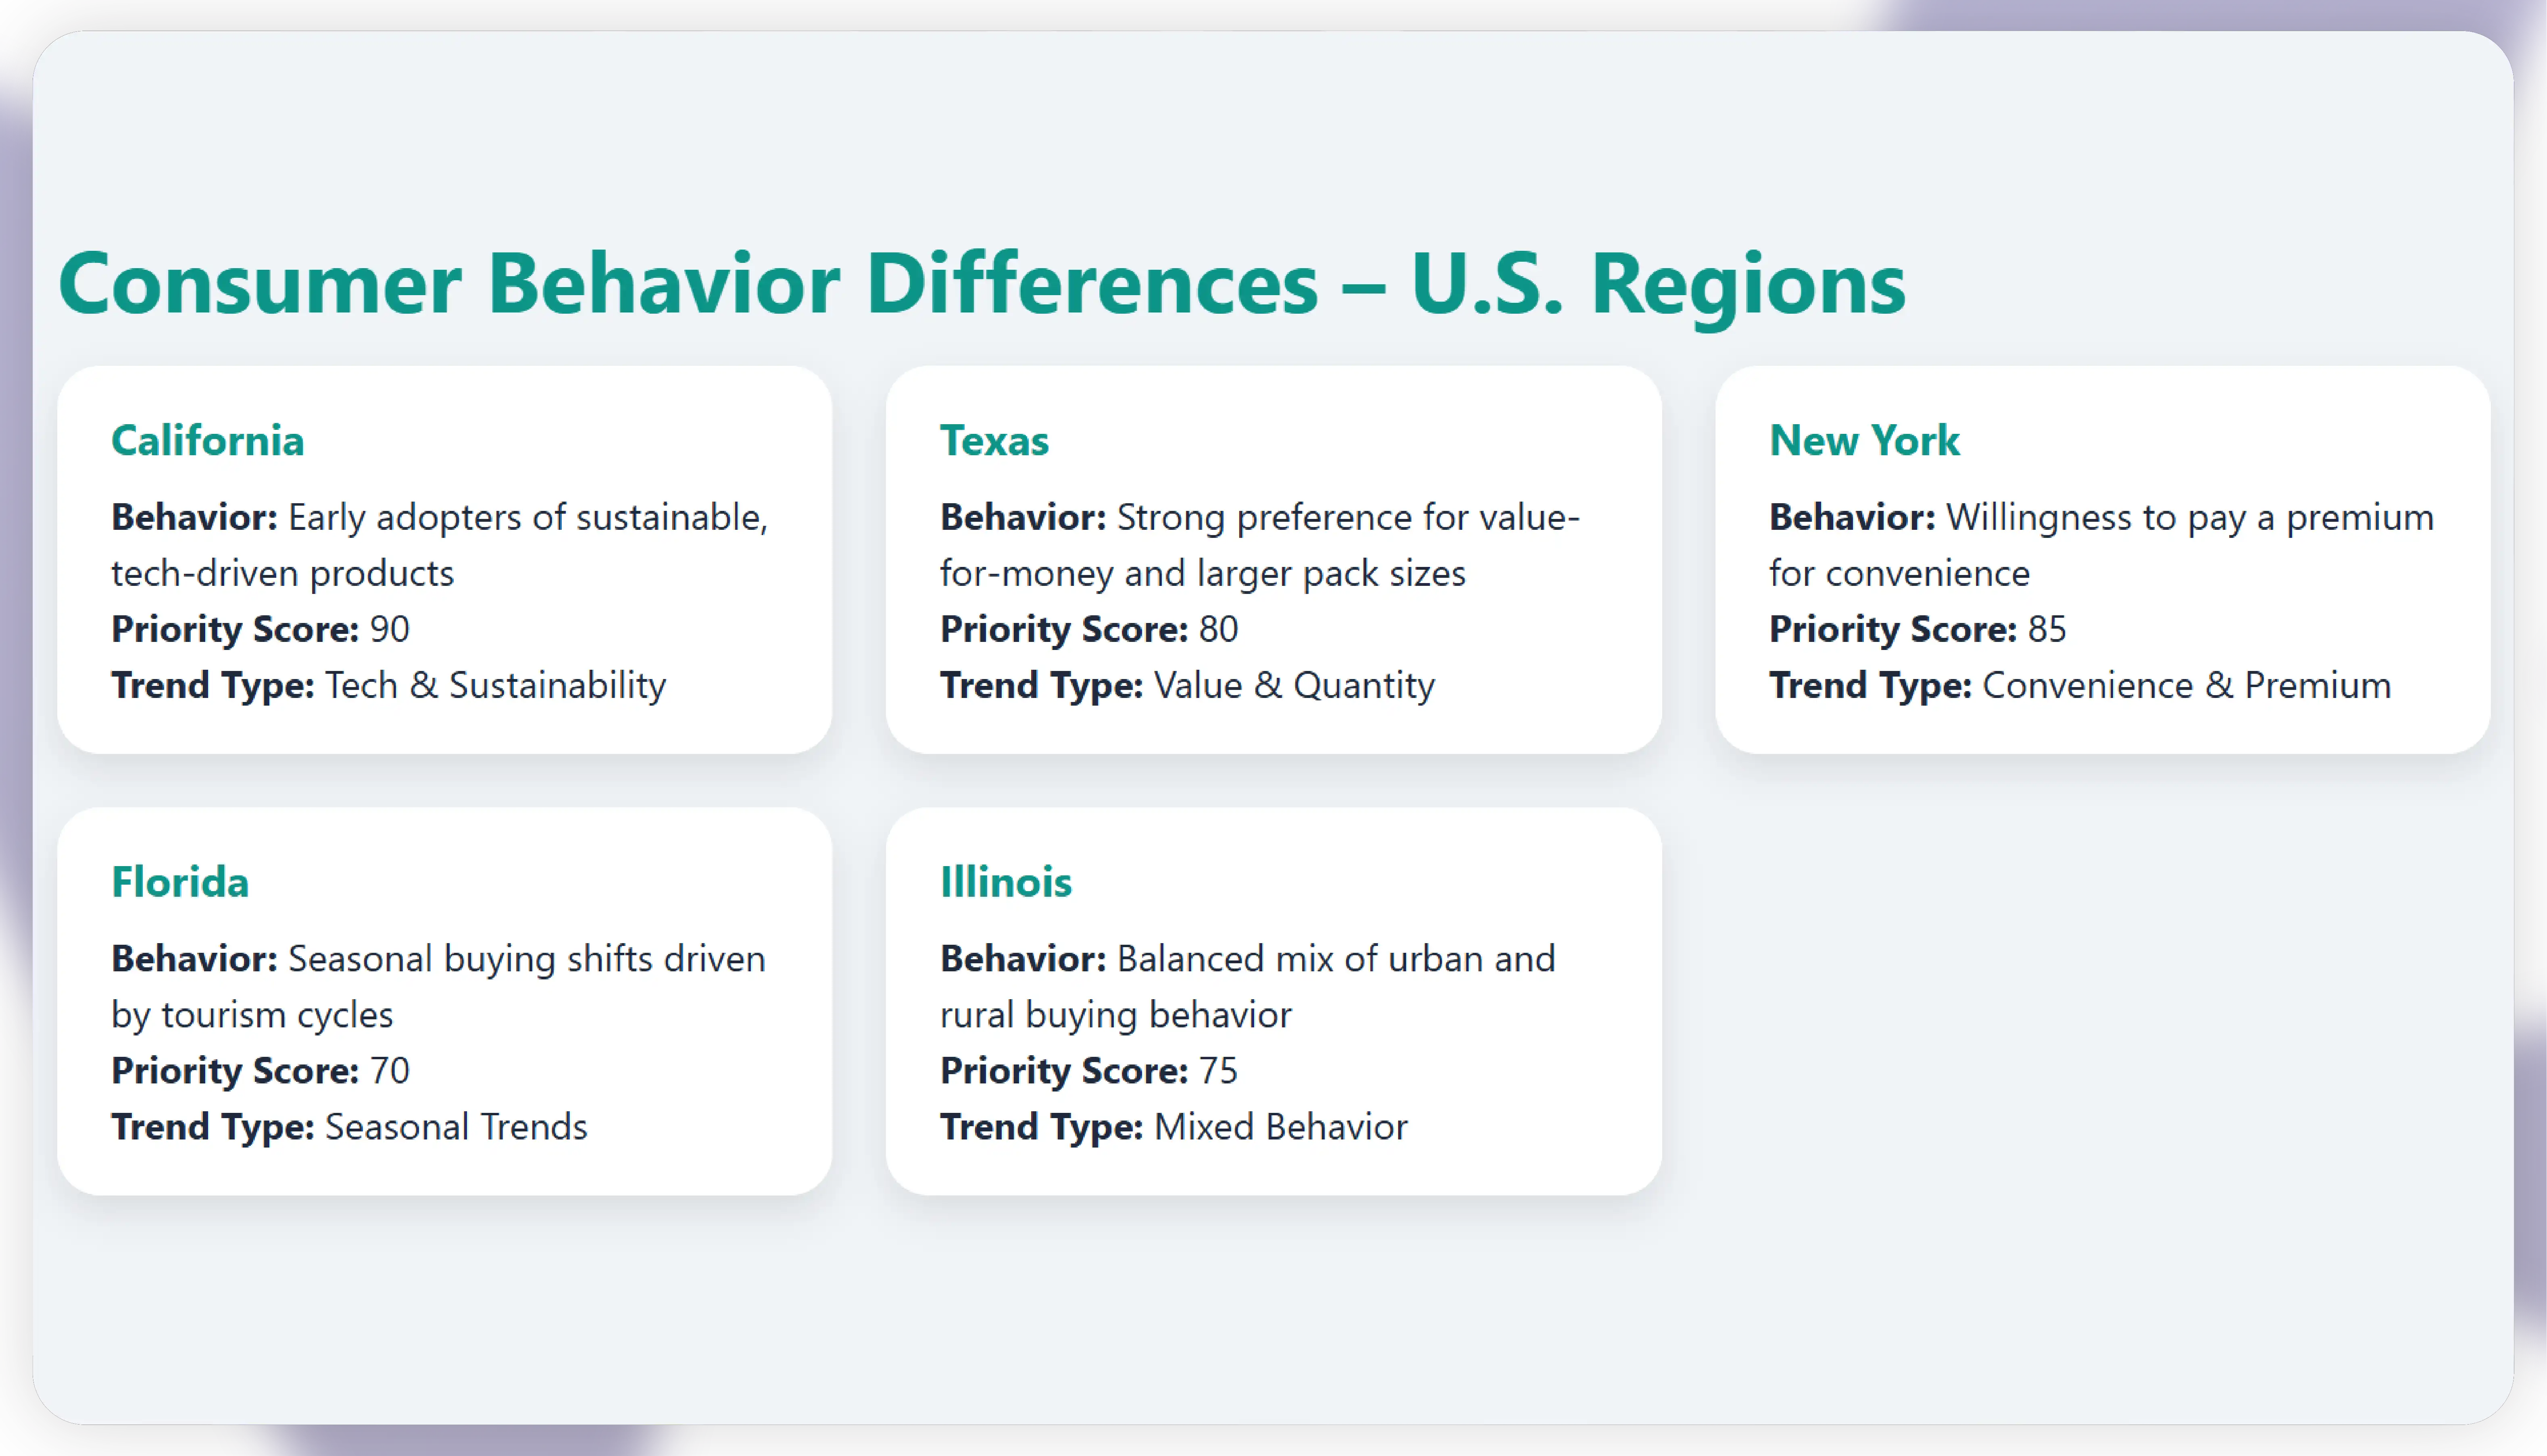
Different regions of the U.S. often have unique buying patterns:
Without regional data scraping, these variations are hidden under national averages.
Some competitors dominate locally but have no presence nationally. For example:
Actowiz Metrics uses location-specific web scraping to map these competitive realities.
Our framework for geographic data collection for business intelligence in the U.S. follows a layered approach.
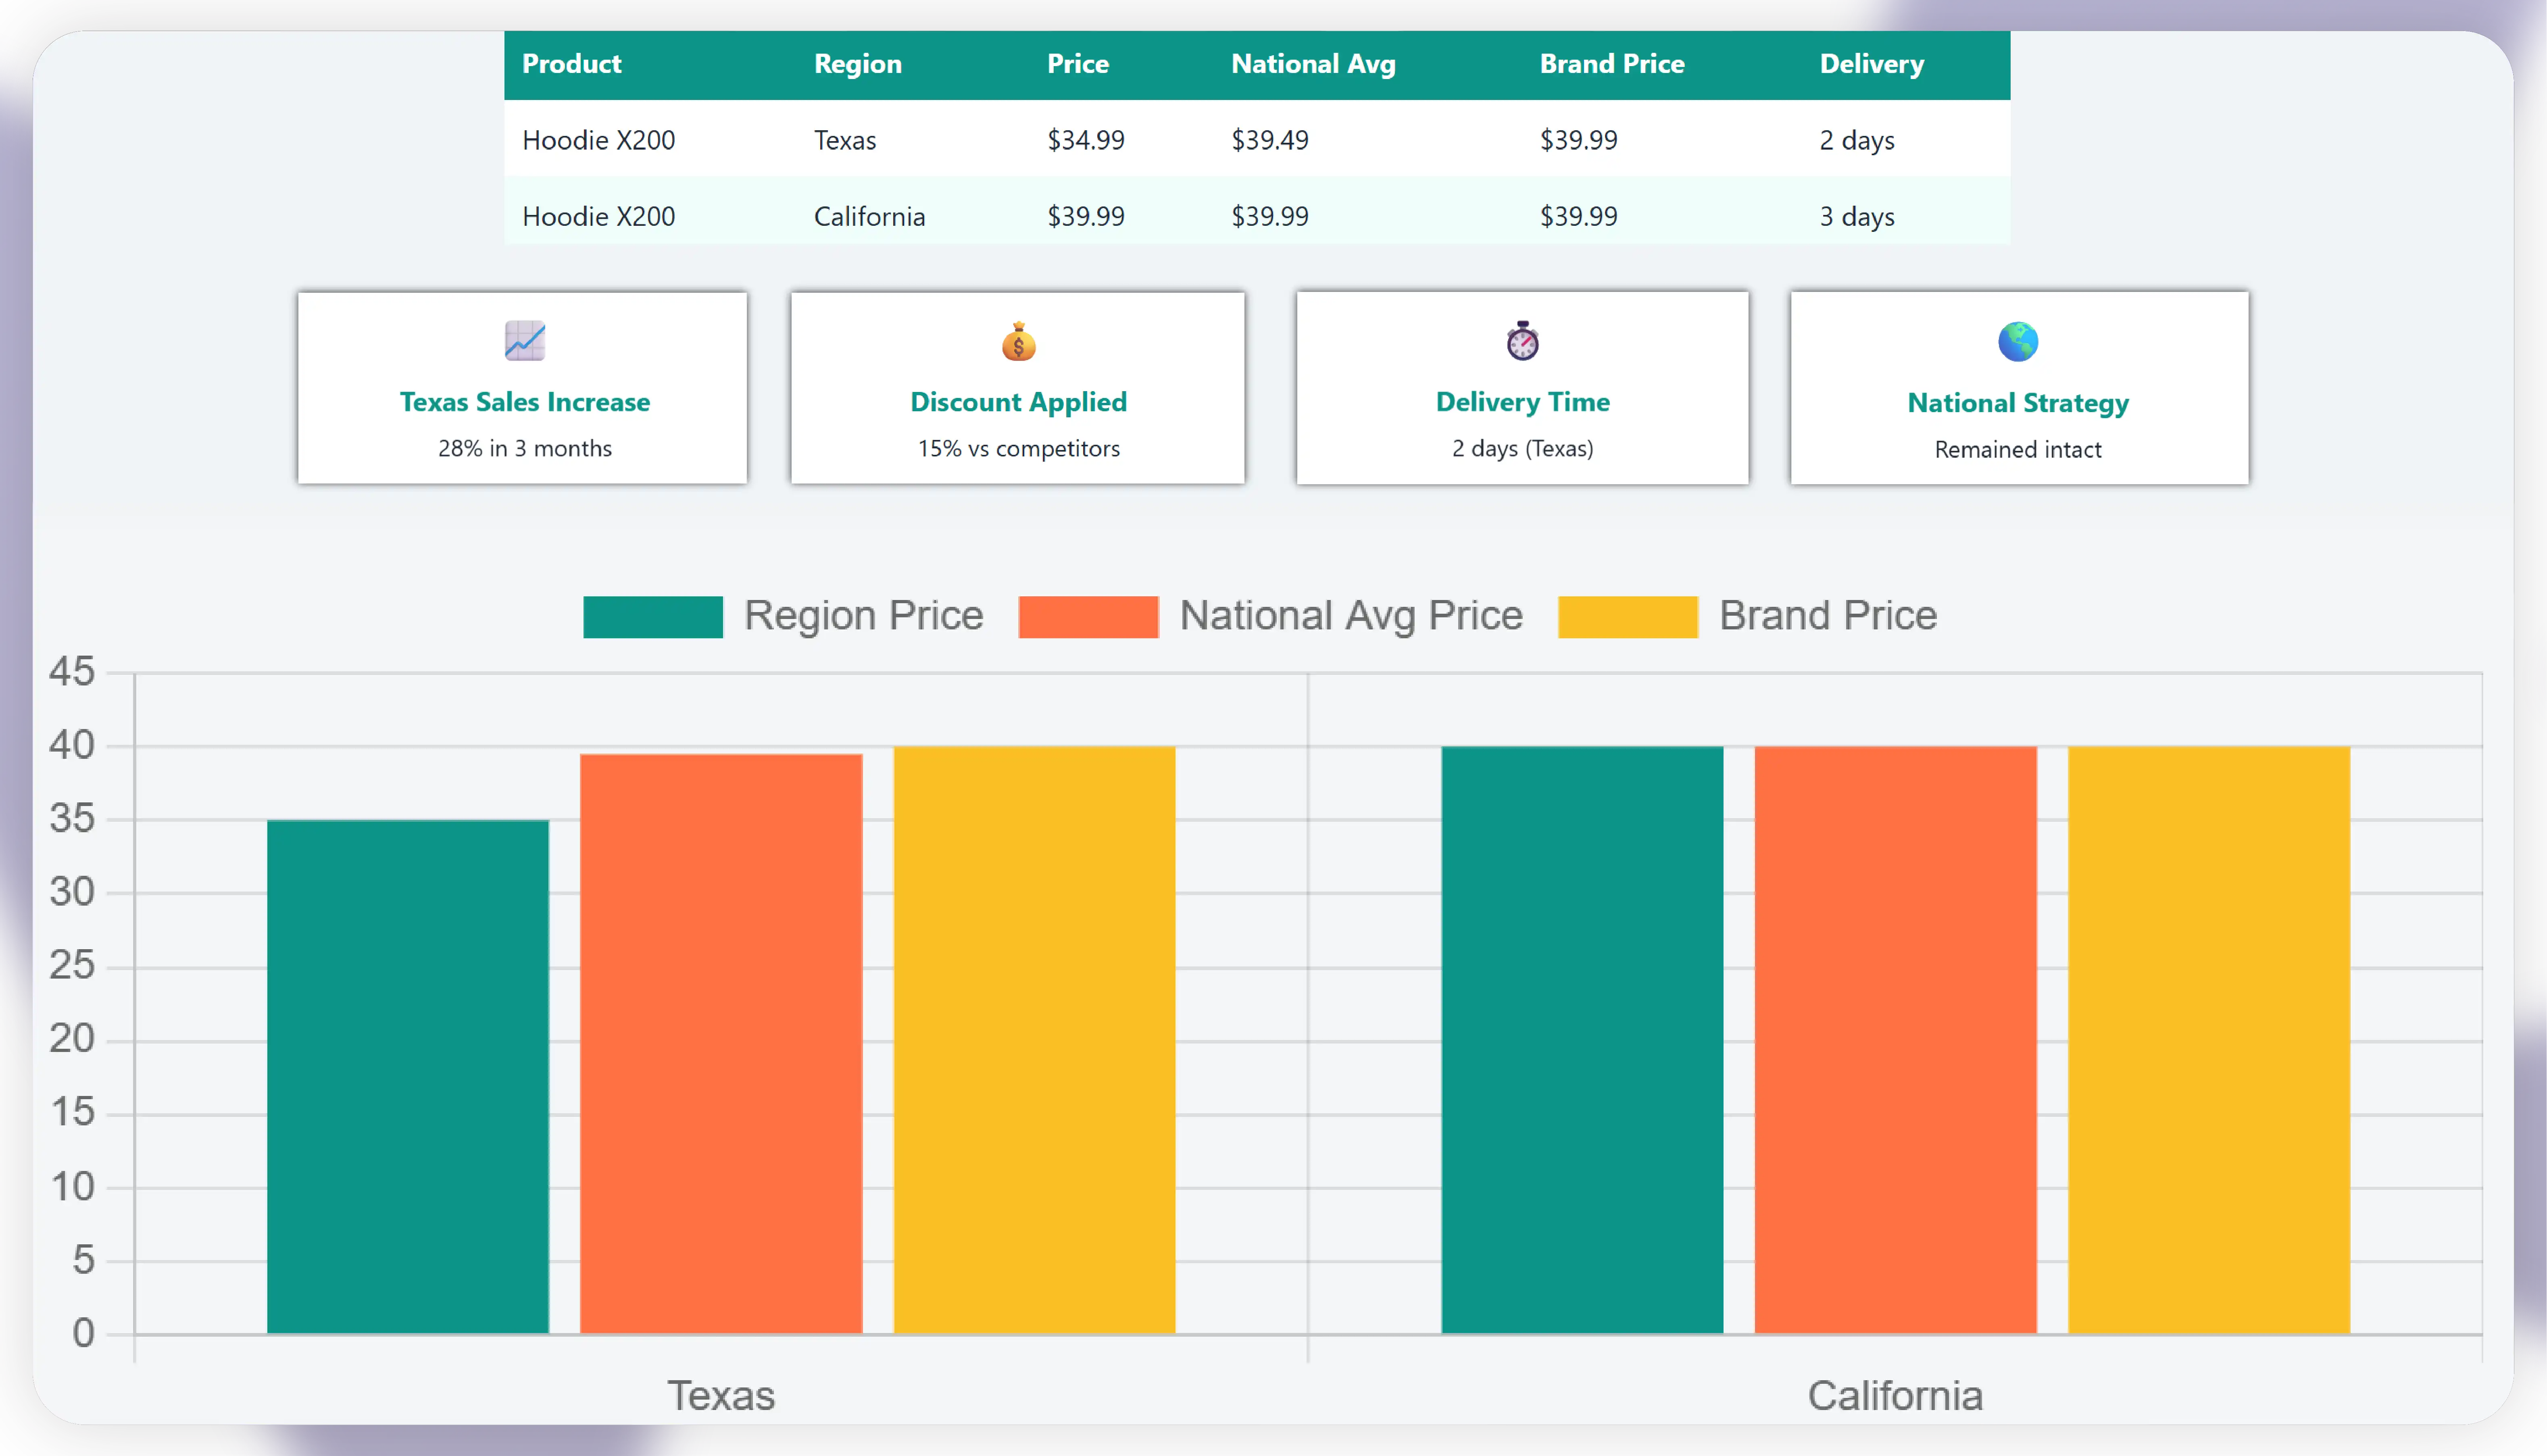
Scenario:
A U.S. apparel retailer noticed stagnant national sales but declining numbers in Southern states.
Actowiz Metrics Approach:
Sample Data:
| Product | Texas Price | National Avg Price | Brand Price | Delivery Time |
|---|---|---|---|---|
| Hoodie X200 | $34.99 | $39.49 | $39.99 | 2 days |
| Hoodie X200 | California | $39.99 | $39.99 | 3 days |
Outcome:
Texas sales rebounded by 28% in 3 months.
National pricing strategy remained intact.
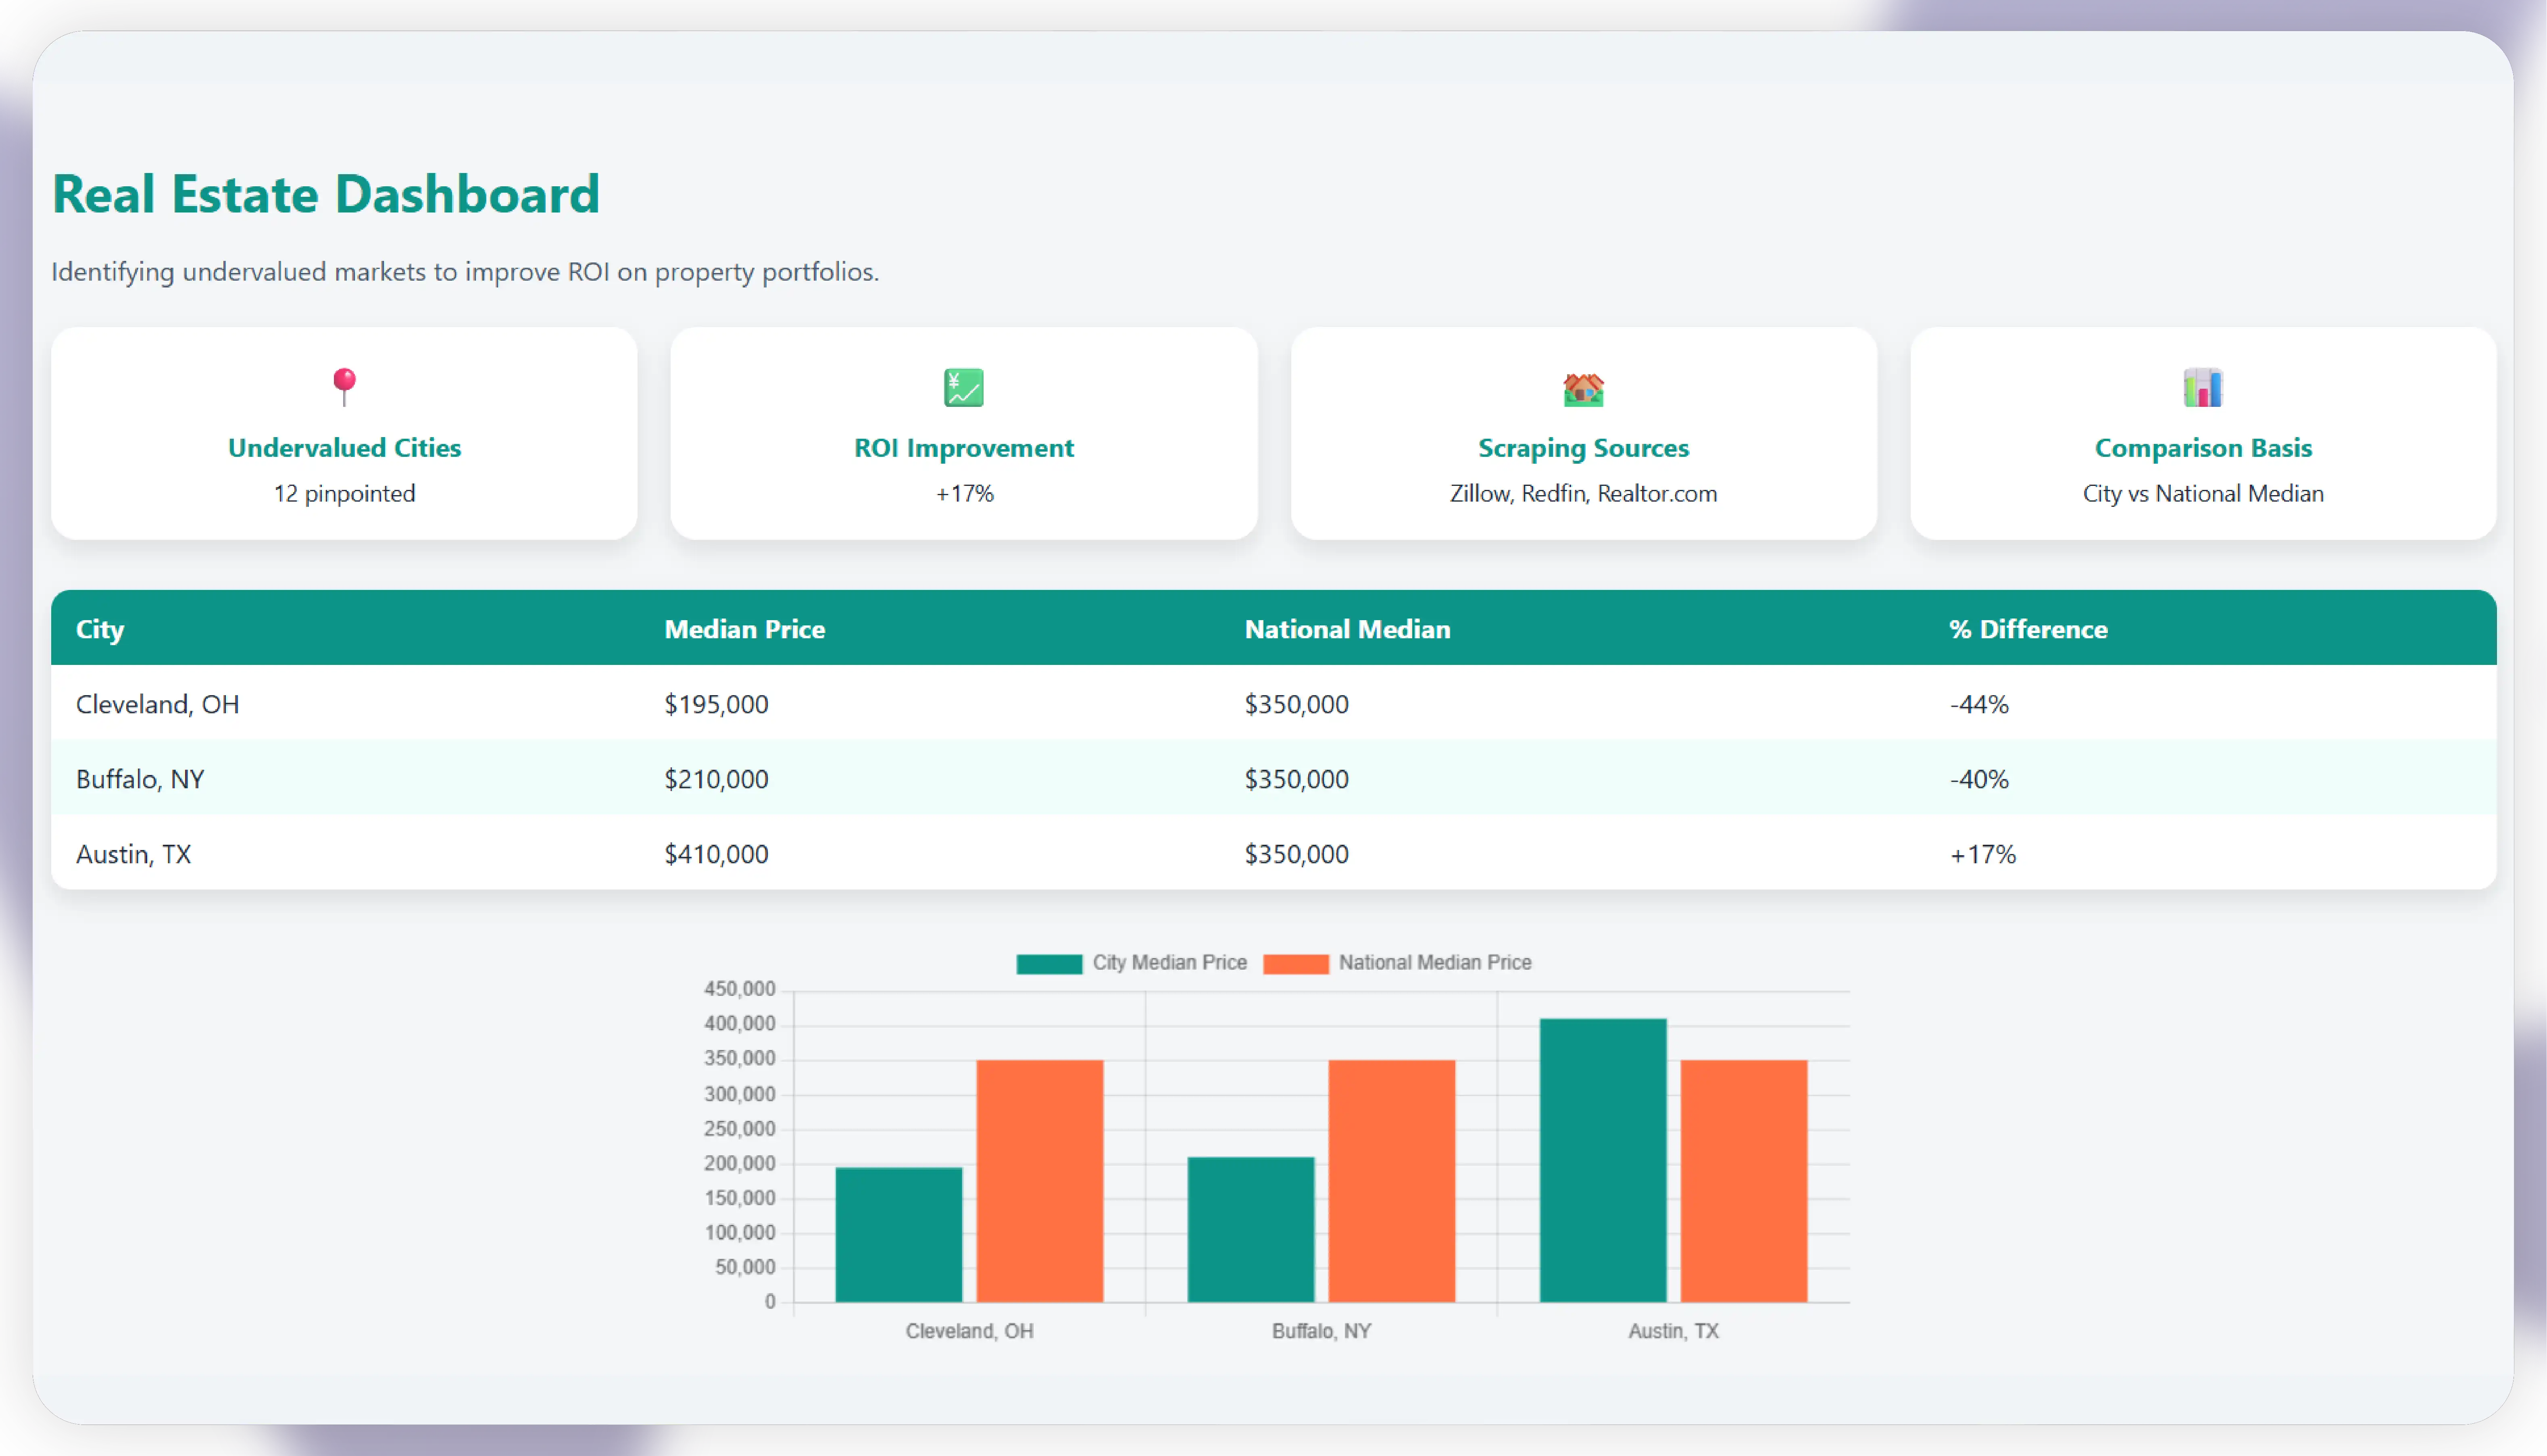
Scenario:
A property investment firm wanted to identify undervalued markets.
Actowiz Metrics Solution:
Scraped Zillow, Redfin, and Realtor.com.
Compared city-level data to the national median.
Sample Data:
| City | Median Price | National Median | % Difference |
|---|---|---|---|
| Cleveland, OH | $195,000 | $350,000 | -44% |
| Buffalo, NY | $210,000 | $350,000 | -40% |
| Austin, TX | $410,000 | $350,000 | +17% |
Outcome:
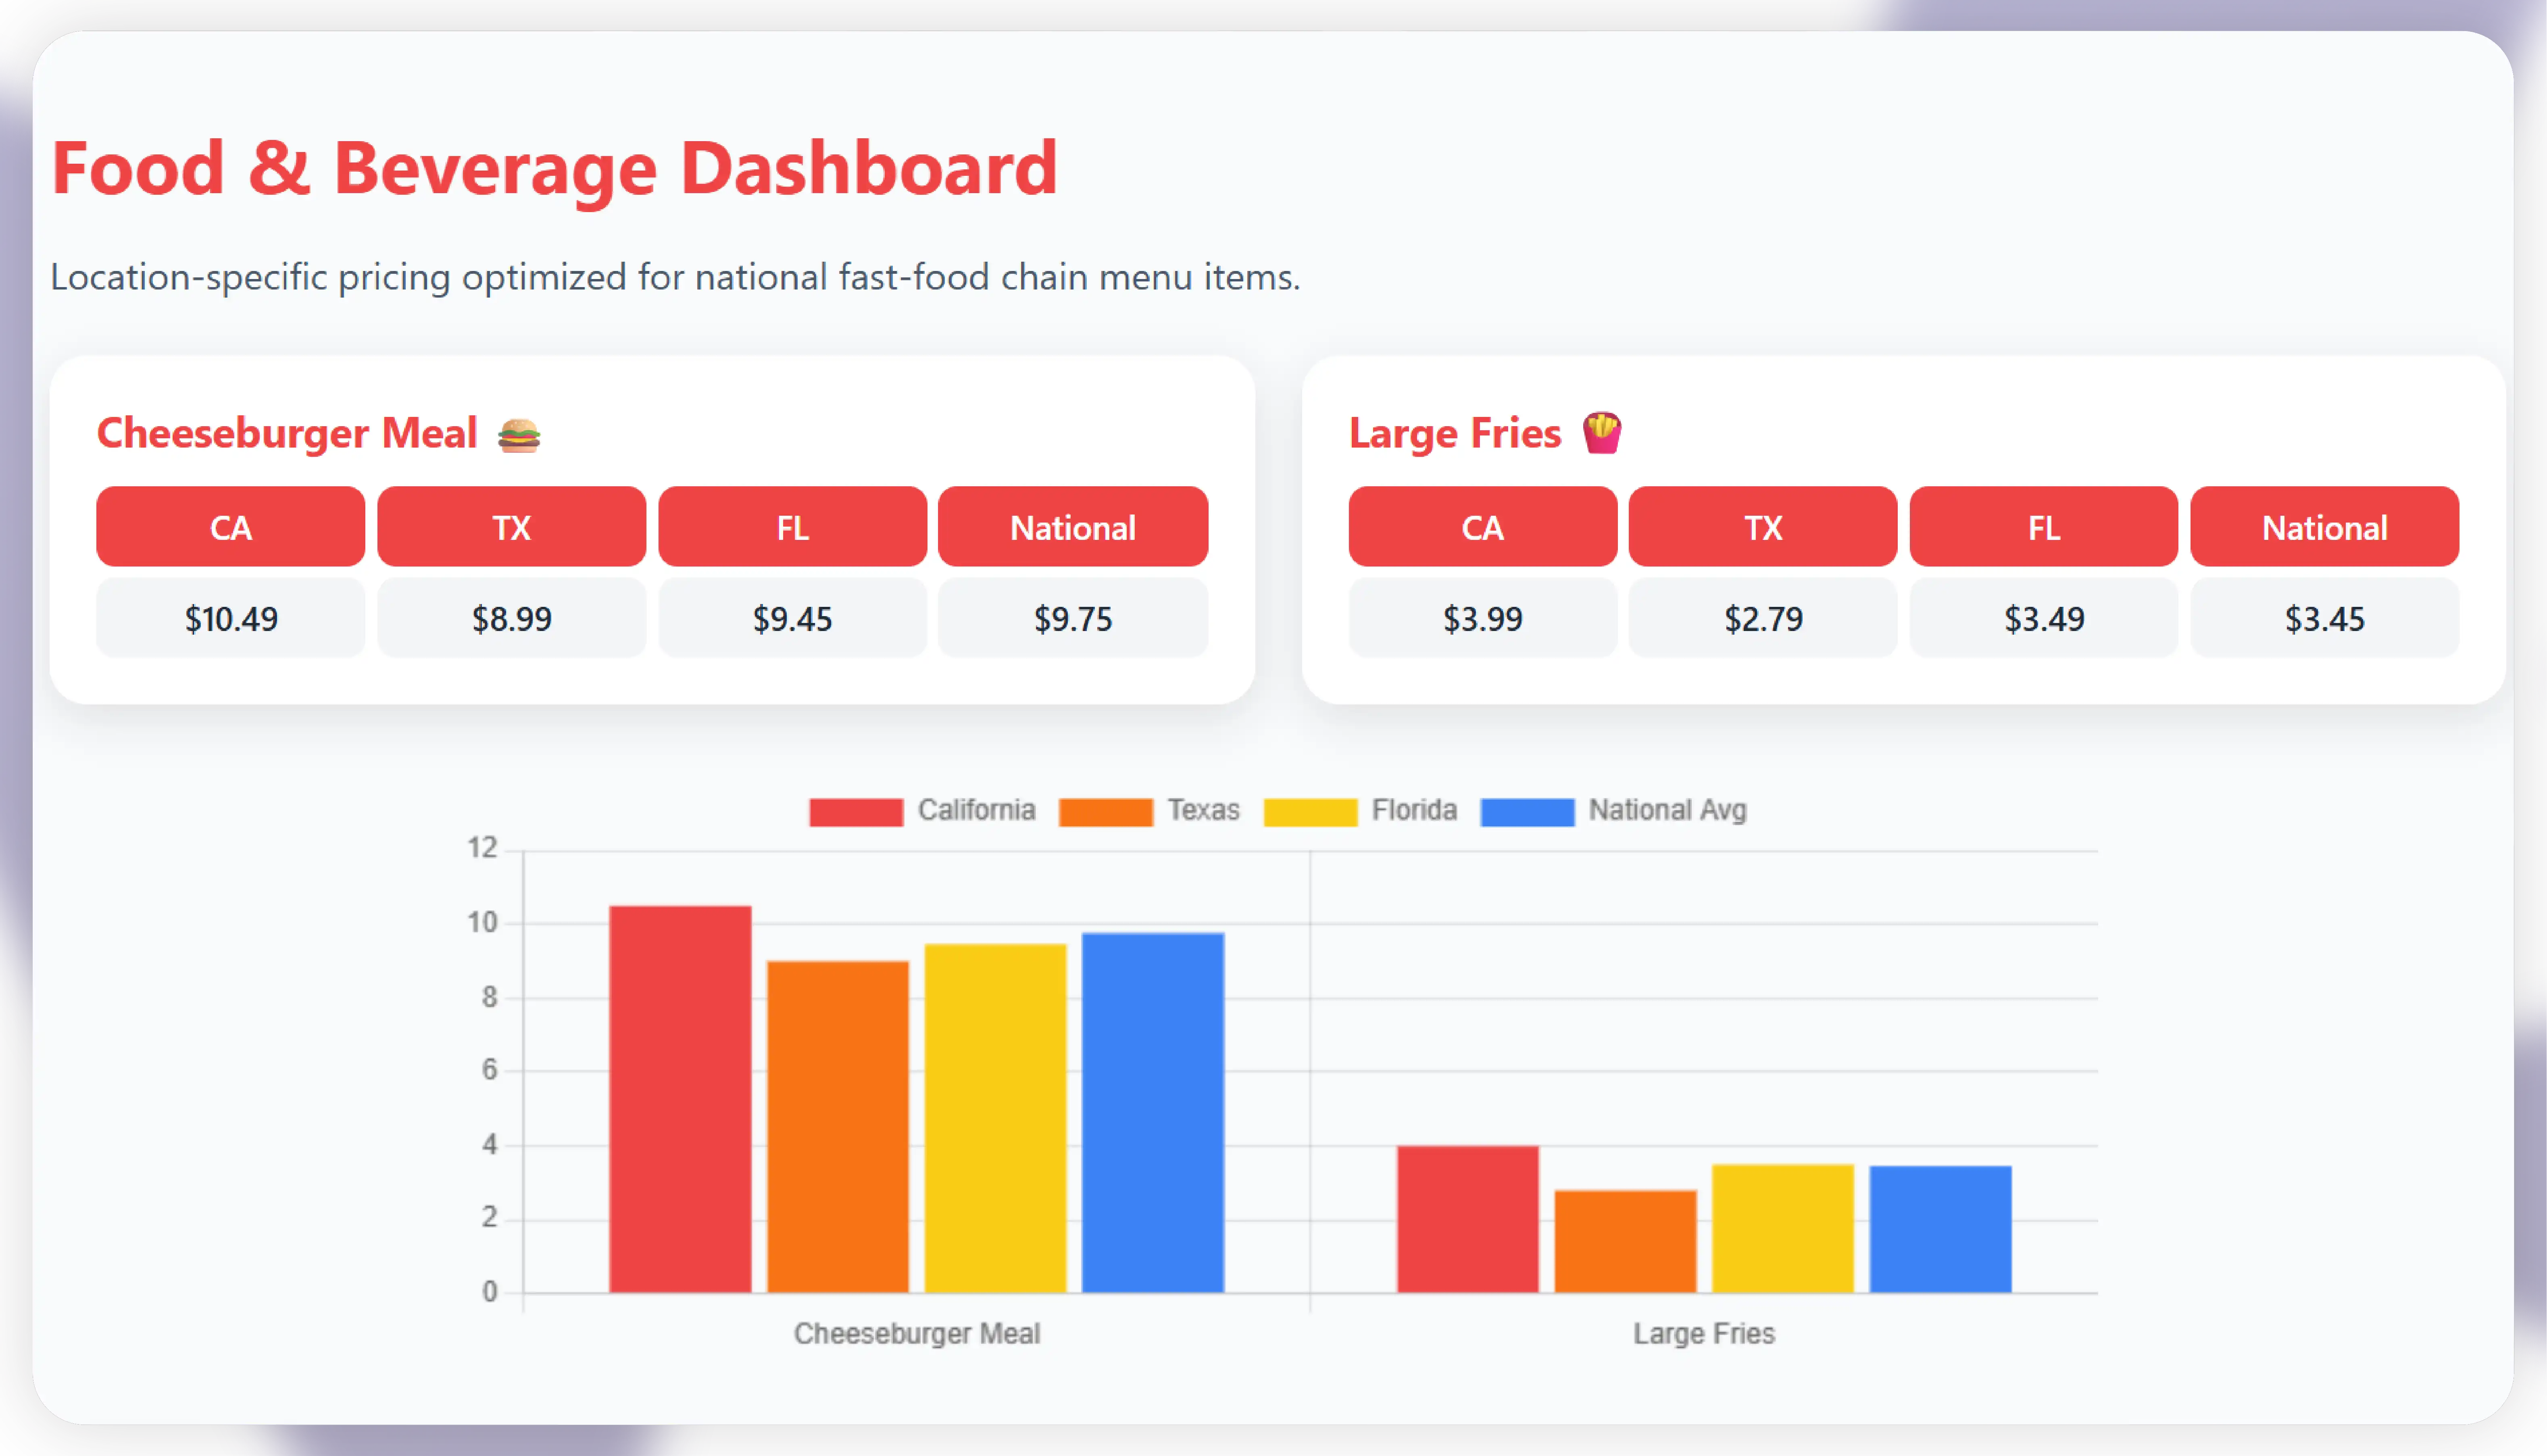
Scenario:
A national fast-food chain needed location-specific web scraping to optimize menu prices.
Sample Data:
| Item | California | Texas | Florida | National Avg |
|---|---|---|---|---|
| Cheeseburger Meal | $10.49 | $8.99 | $9.45 | $9.75 |
| Large Fries | $3.99 | $2.79 | $3.49 | $3.45 |
Outcome:
Scenario:
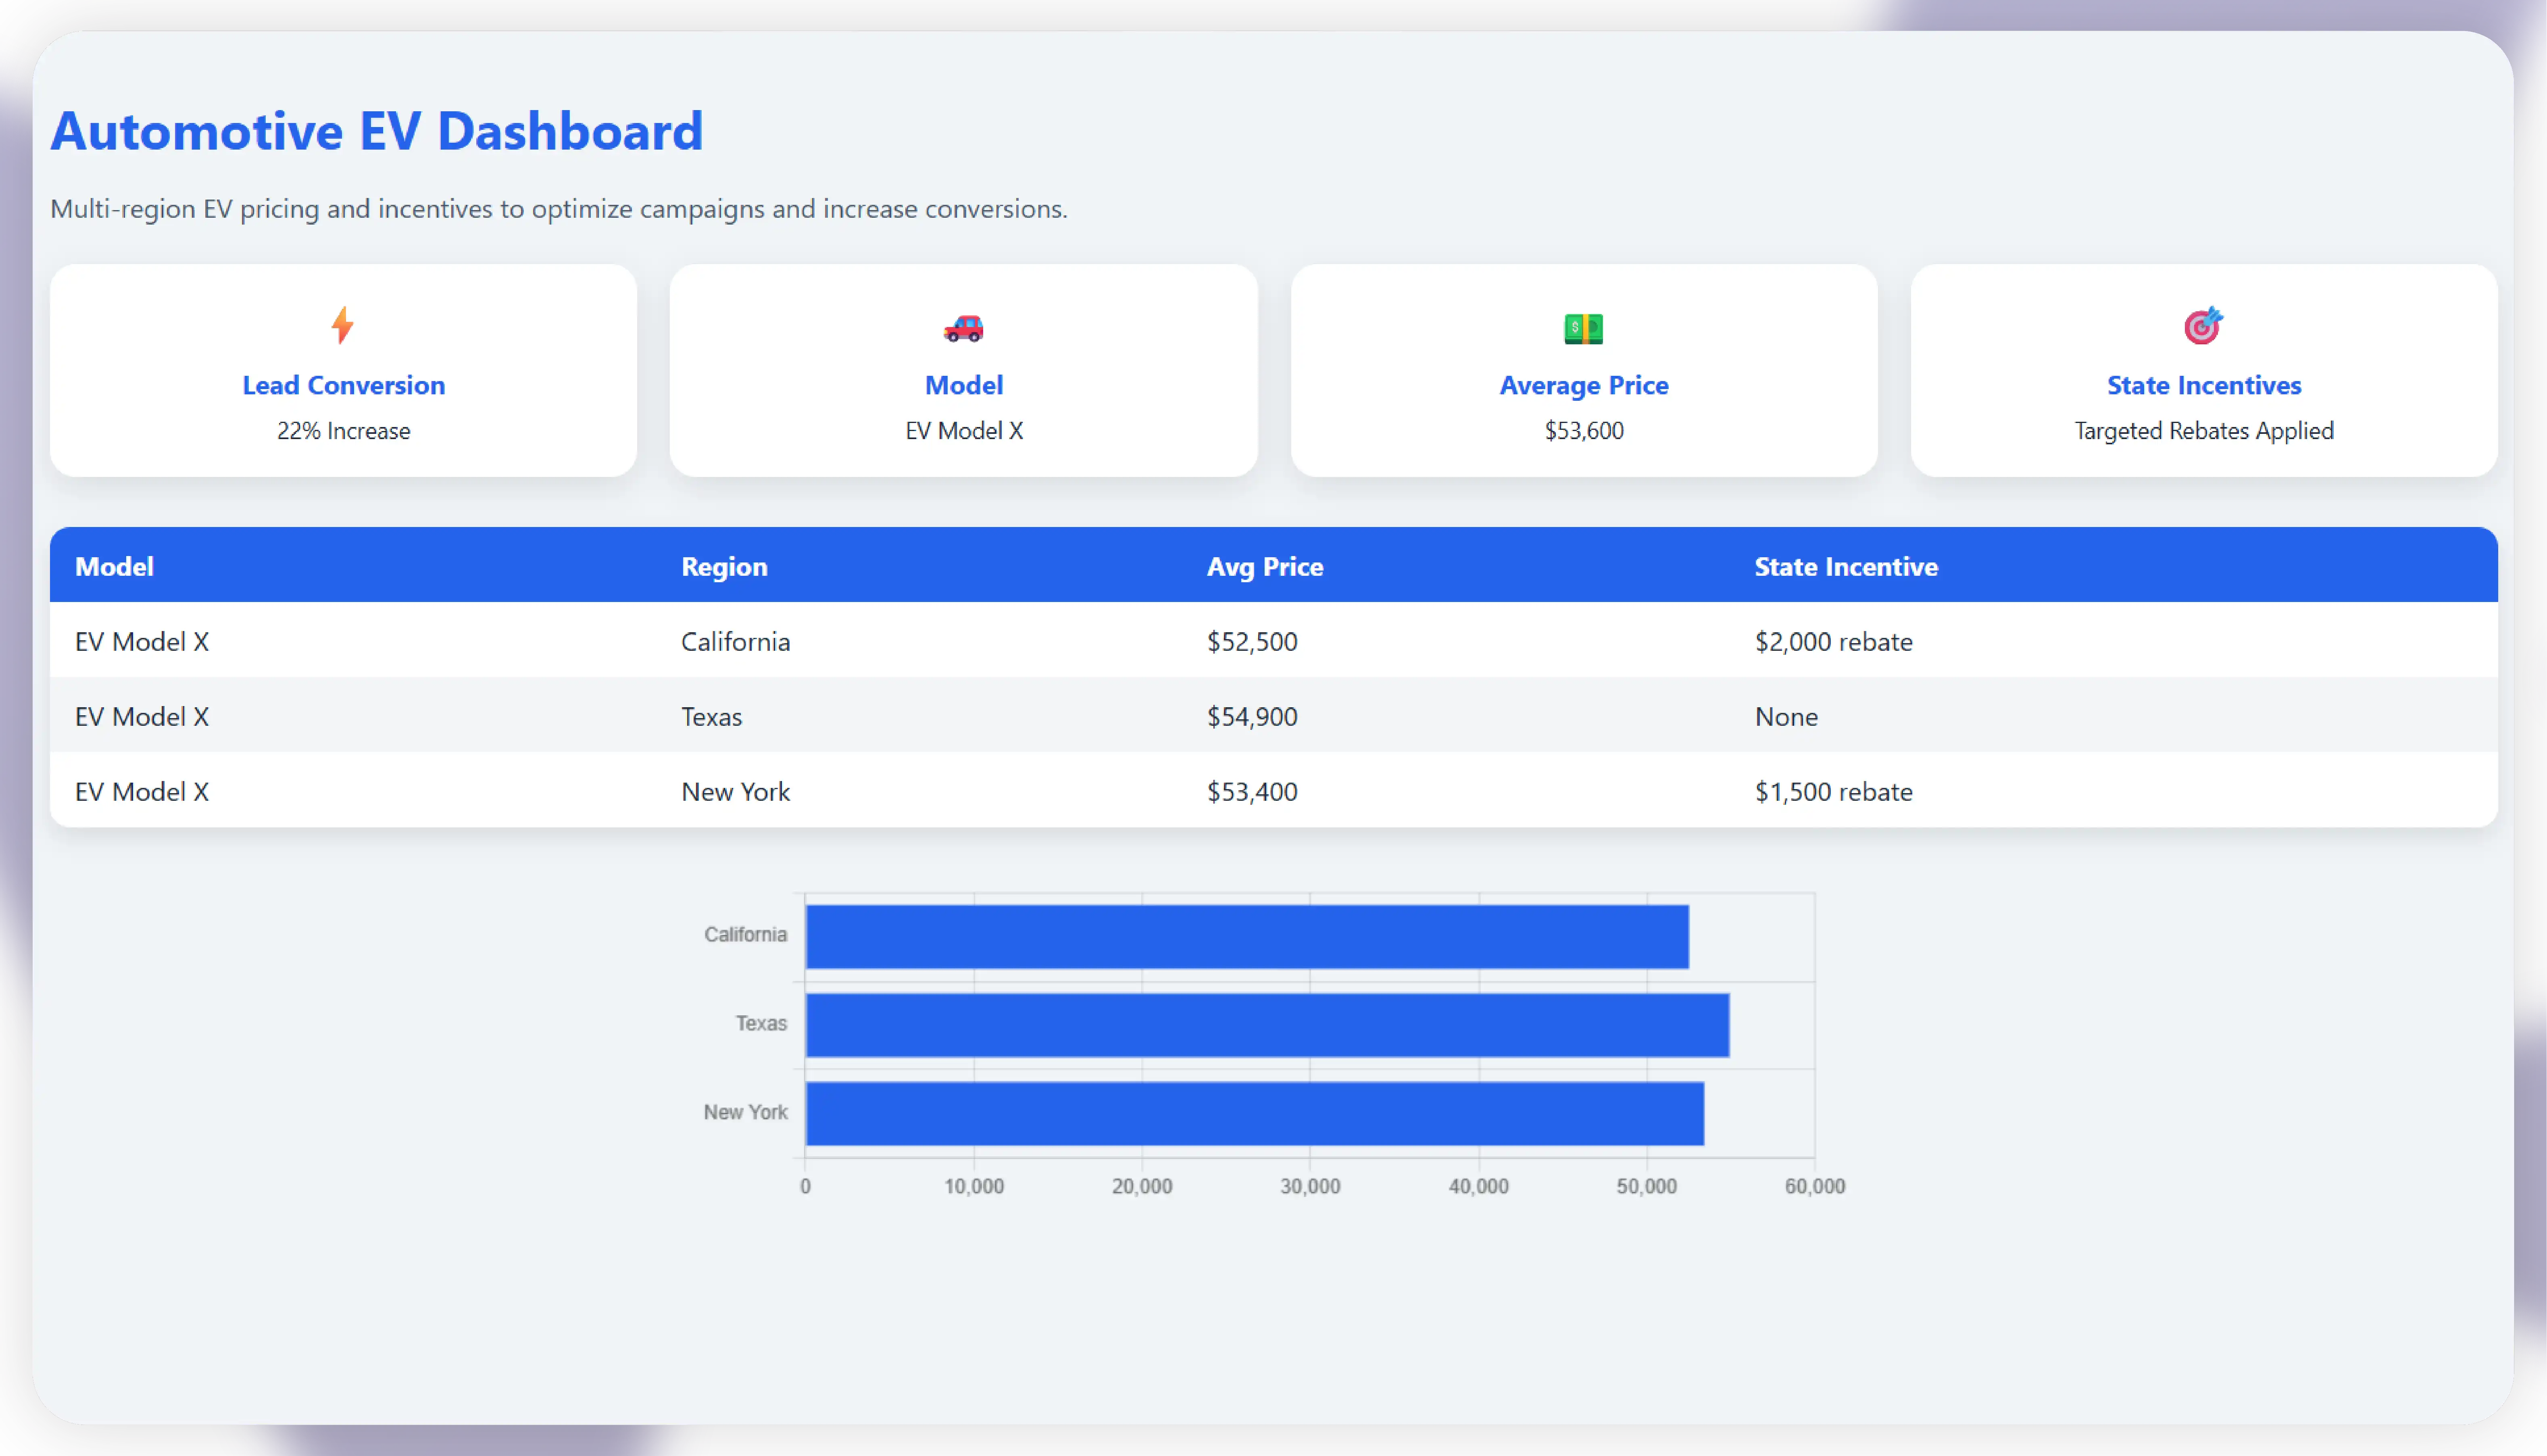
An EV dealer network wanted multi-region data monitoring of competitor pricing.
Sample Data:
| Model | Region | Avg Price | State Incentive |
|---|---|---|---|
| EV Model X | California | $52,500 | $2,000 rebate |
| EV Model X | Texas | $54,900 | None |
| EV Model X | New York | $53,400 | $1,500 rebate |
Outcome:
Scenario:
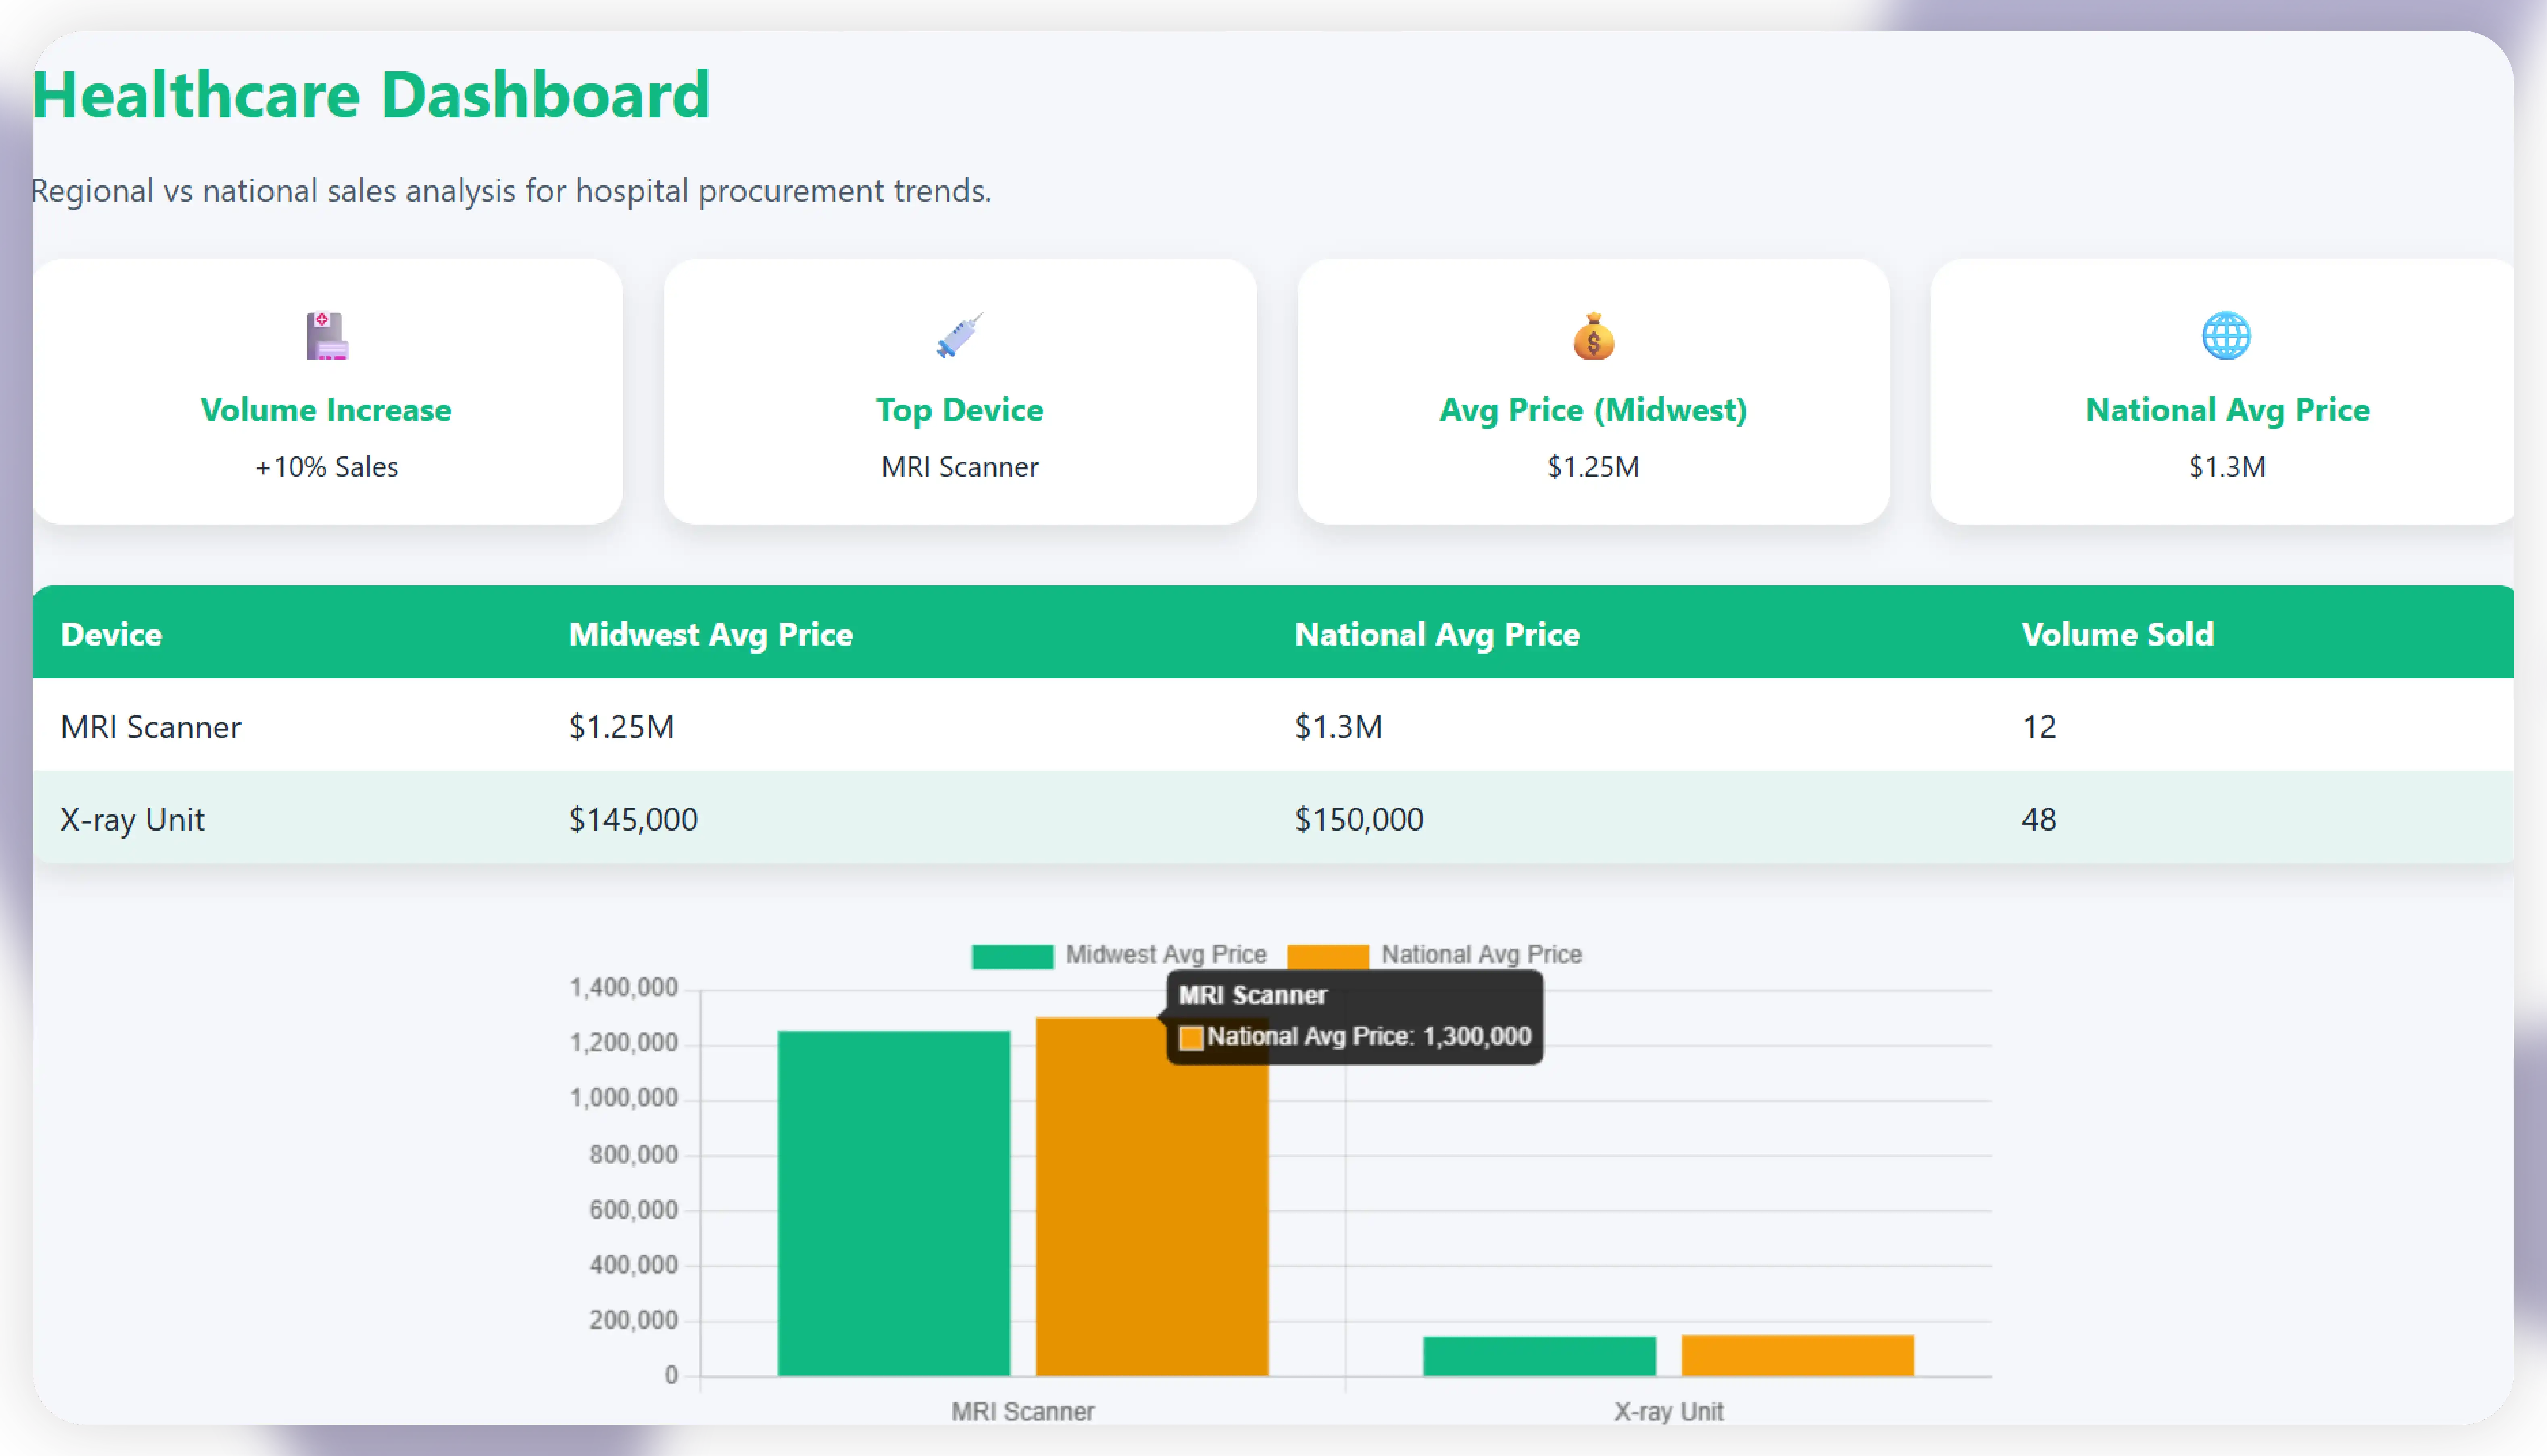
A medical device supplier wanted regional vs national sales analysis for hospital procurement trends.
Sample Data:
| Device | Midwest Avg Price | National Avg Price | Volume Sold |
|---|---|---|---|
| MRI Scanner | $1.25M | $1.3M | 12 |
| X-ray Unit | $145,000 | $150,000 | 48 |
Outcome:
Adjusted regional pricing led to 10% higher sales volumes.
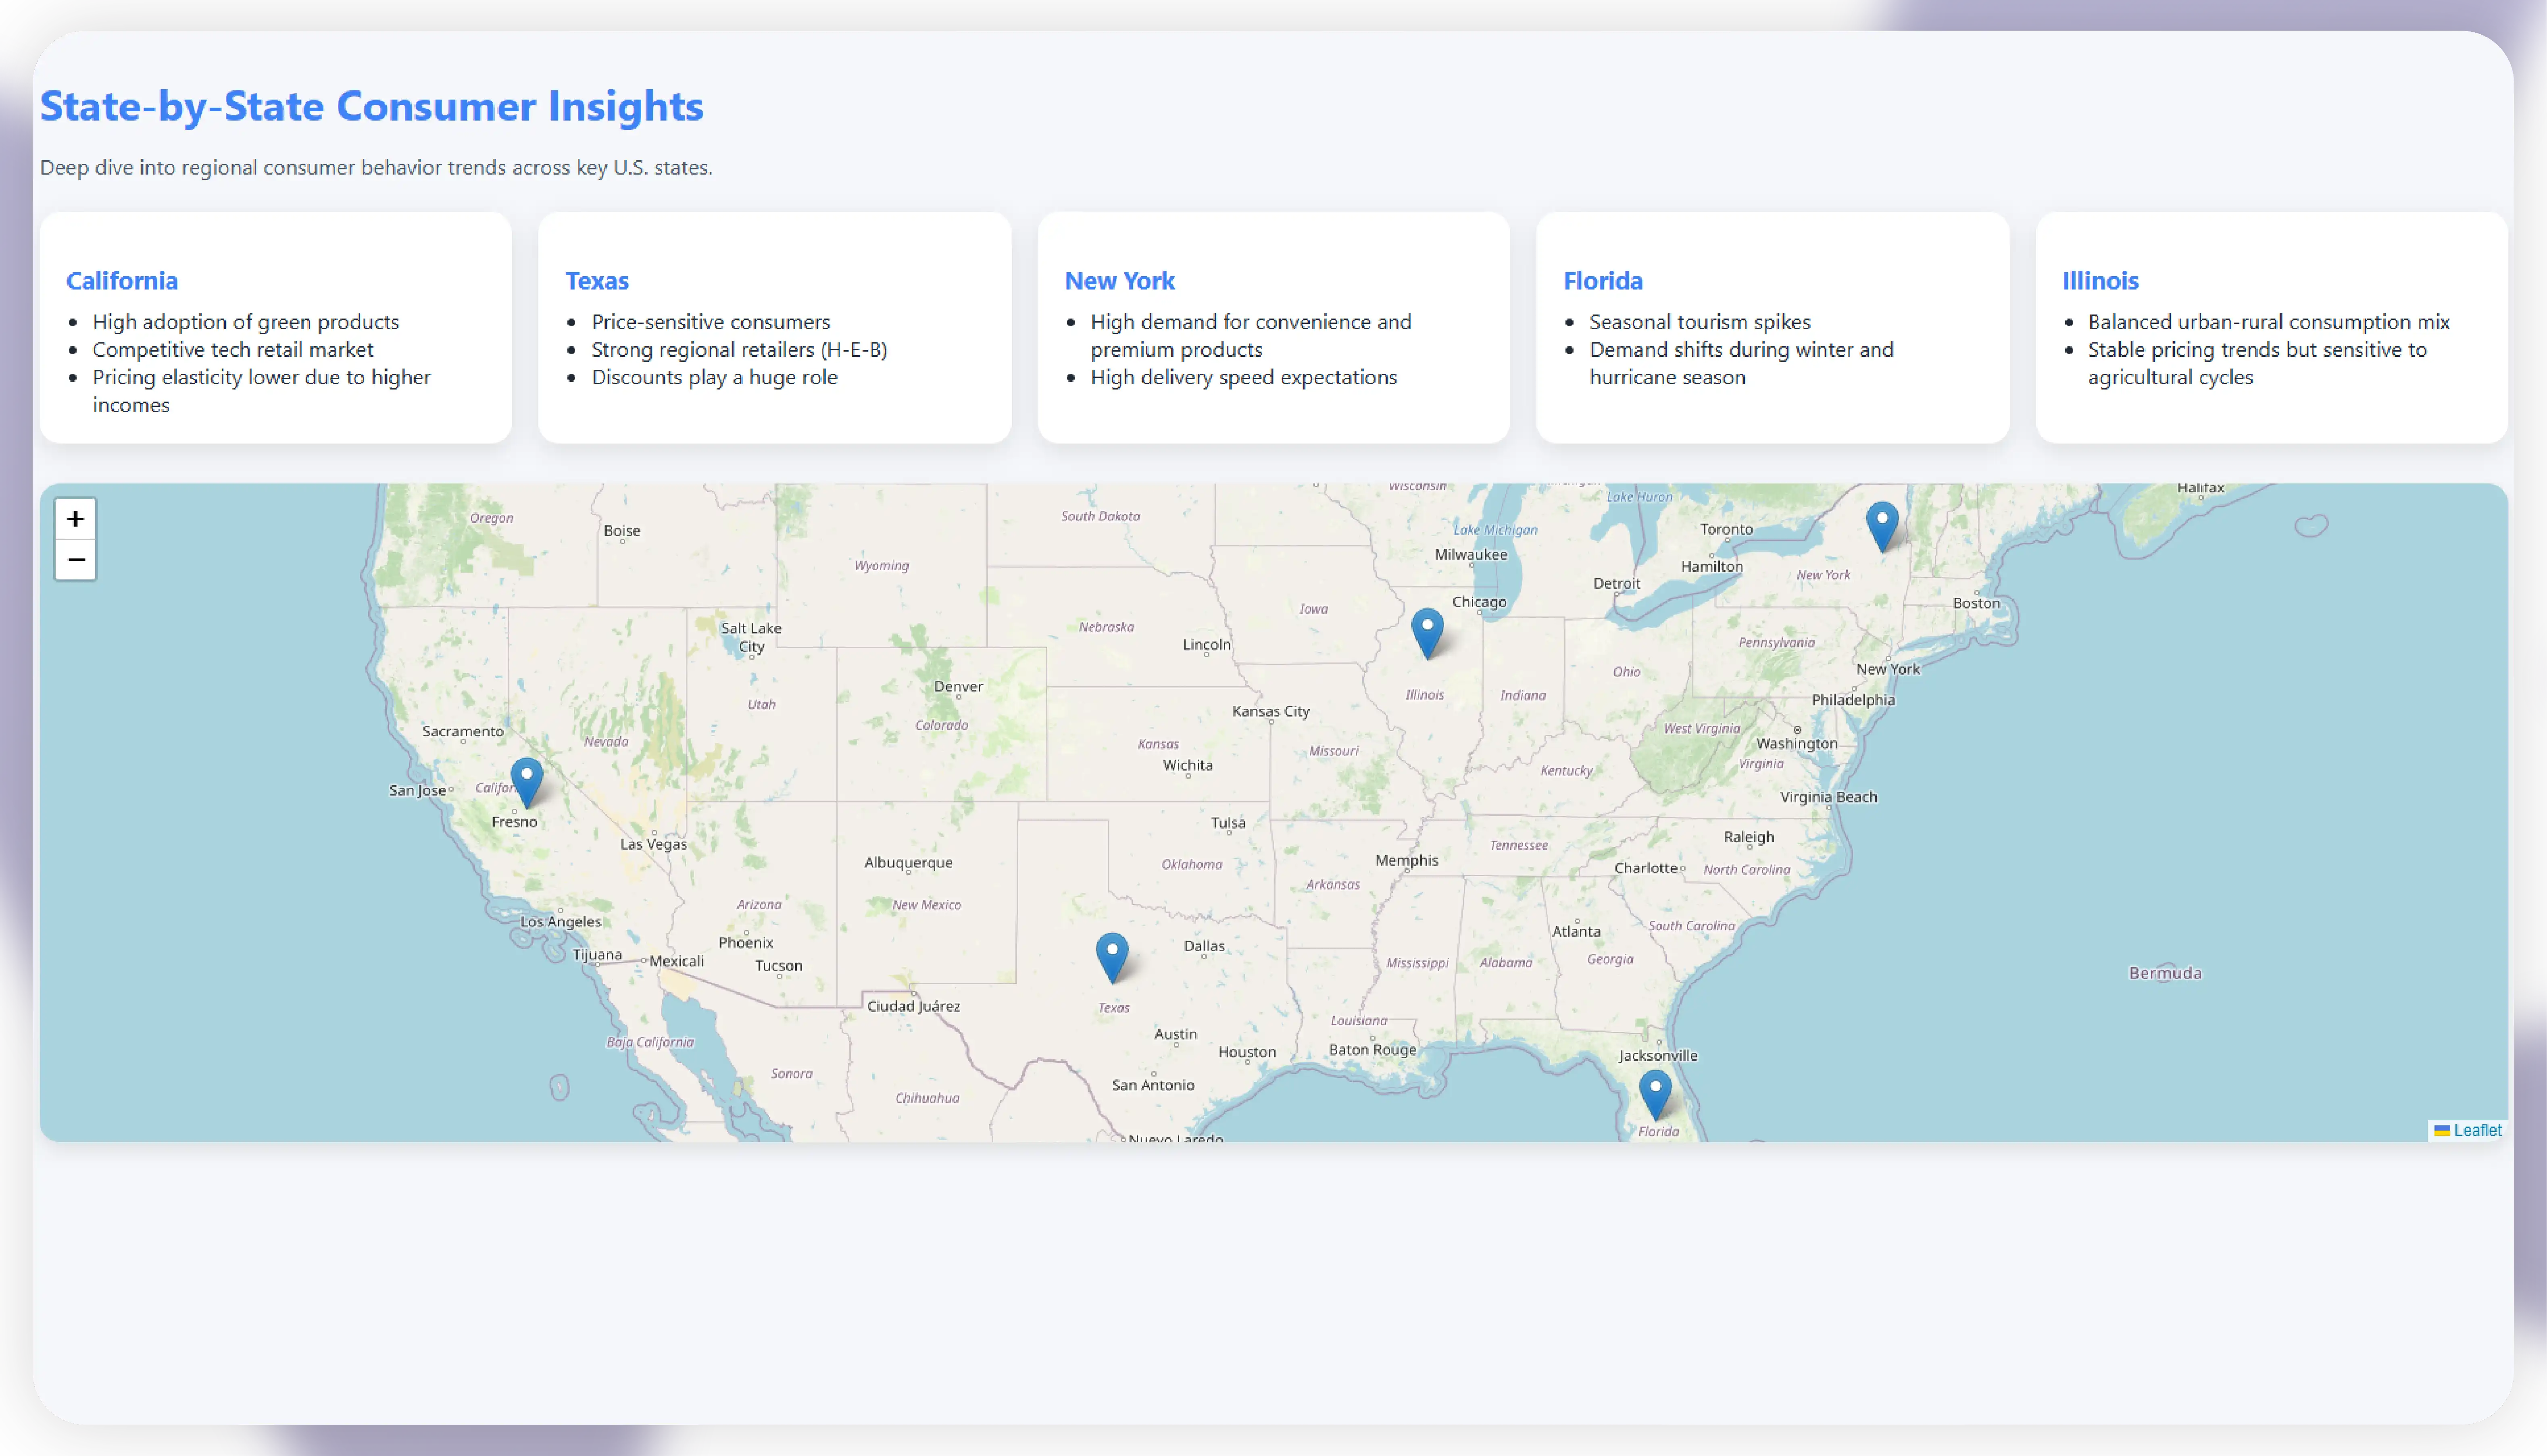
California
Texas
New York
Florida
Illinois
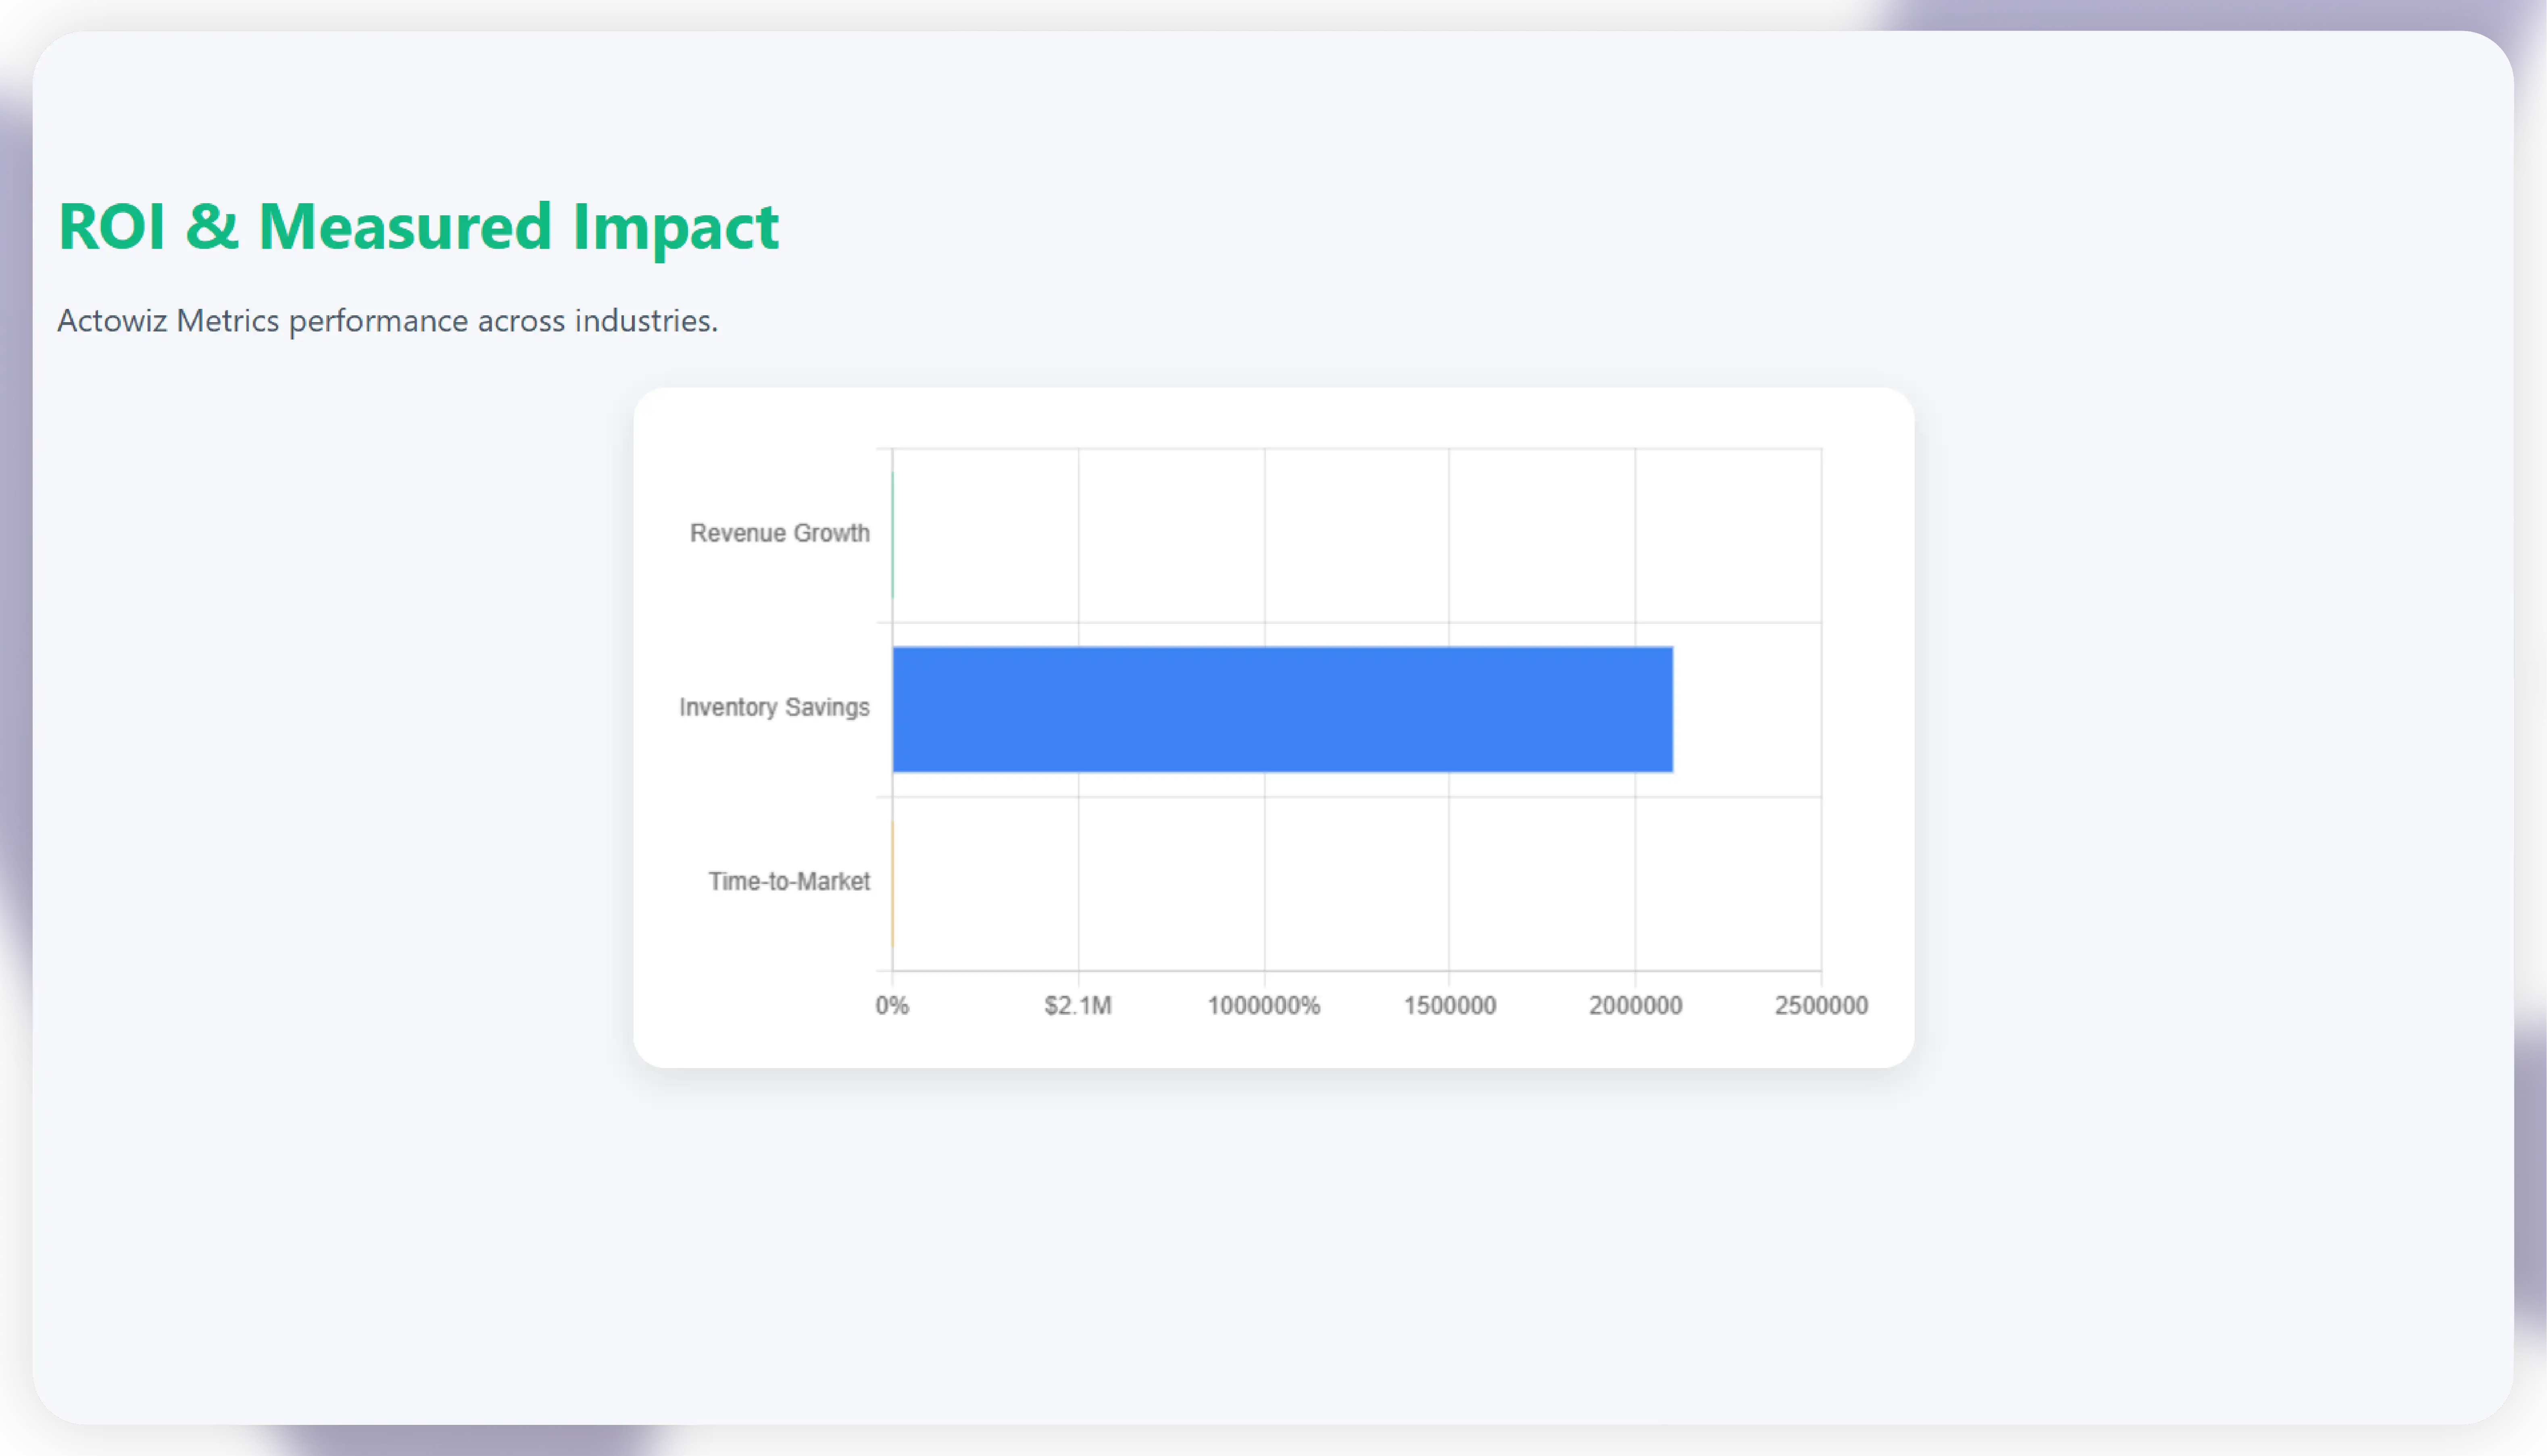
Across all industries, Actowiz Metrics has delivered:
In the U.S., regional and national data serve different but complementary roles. Actowiz Metrics enables businesses to extract maximum value from regional pricing intelligence, multi-region data monitoring, and national market intelligence, ensuring decisions are both precise and profitable.
Expert blogs, research reports and infographics — practical, data-driven reading across e-commerce and quick-commerce.
Most fields are optional — the more you share, the better your sample.


.webp "infographics")
.webp "infographics")


