BLOG


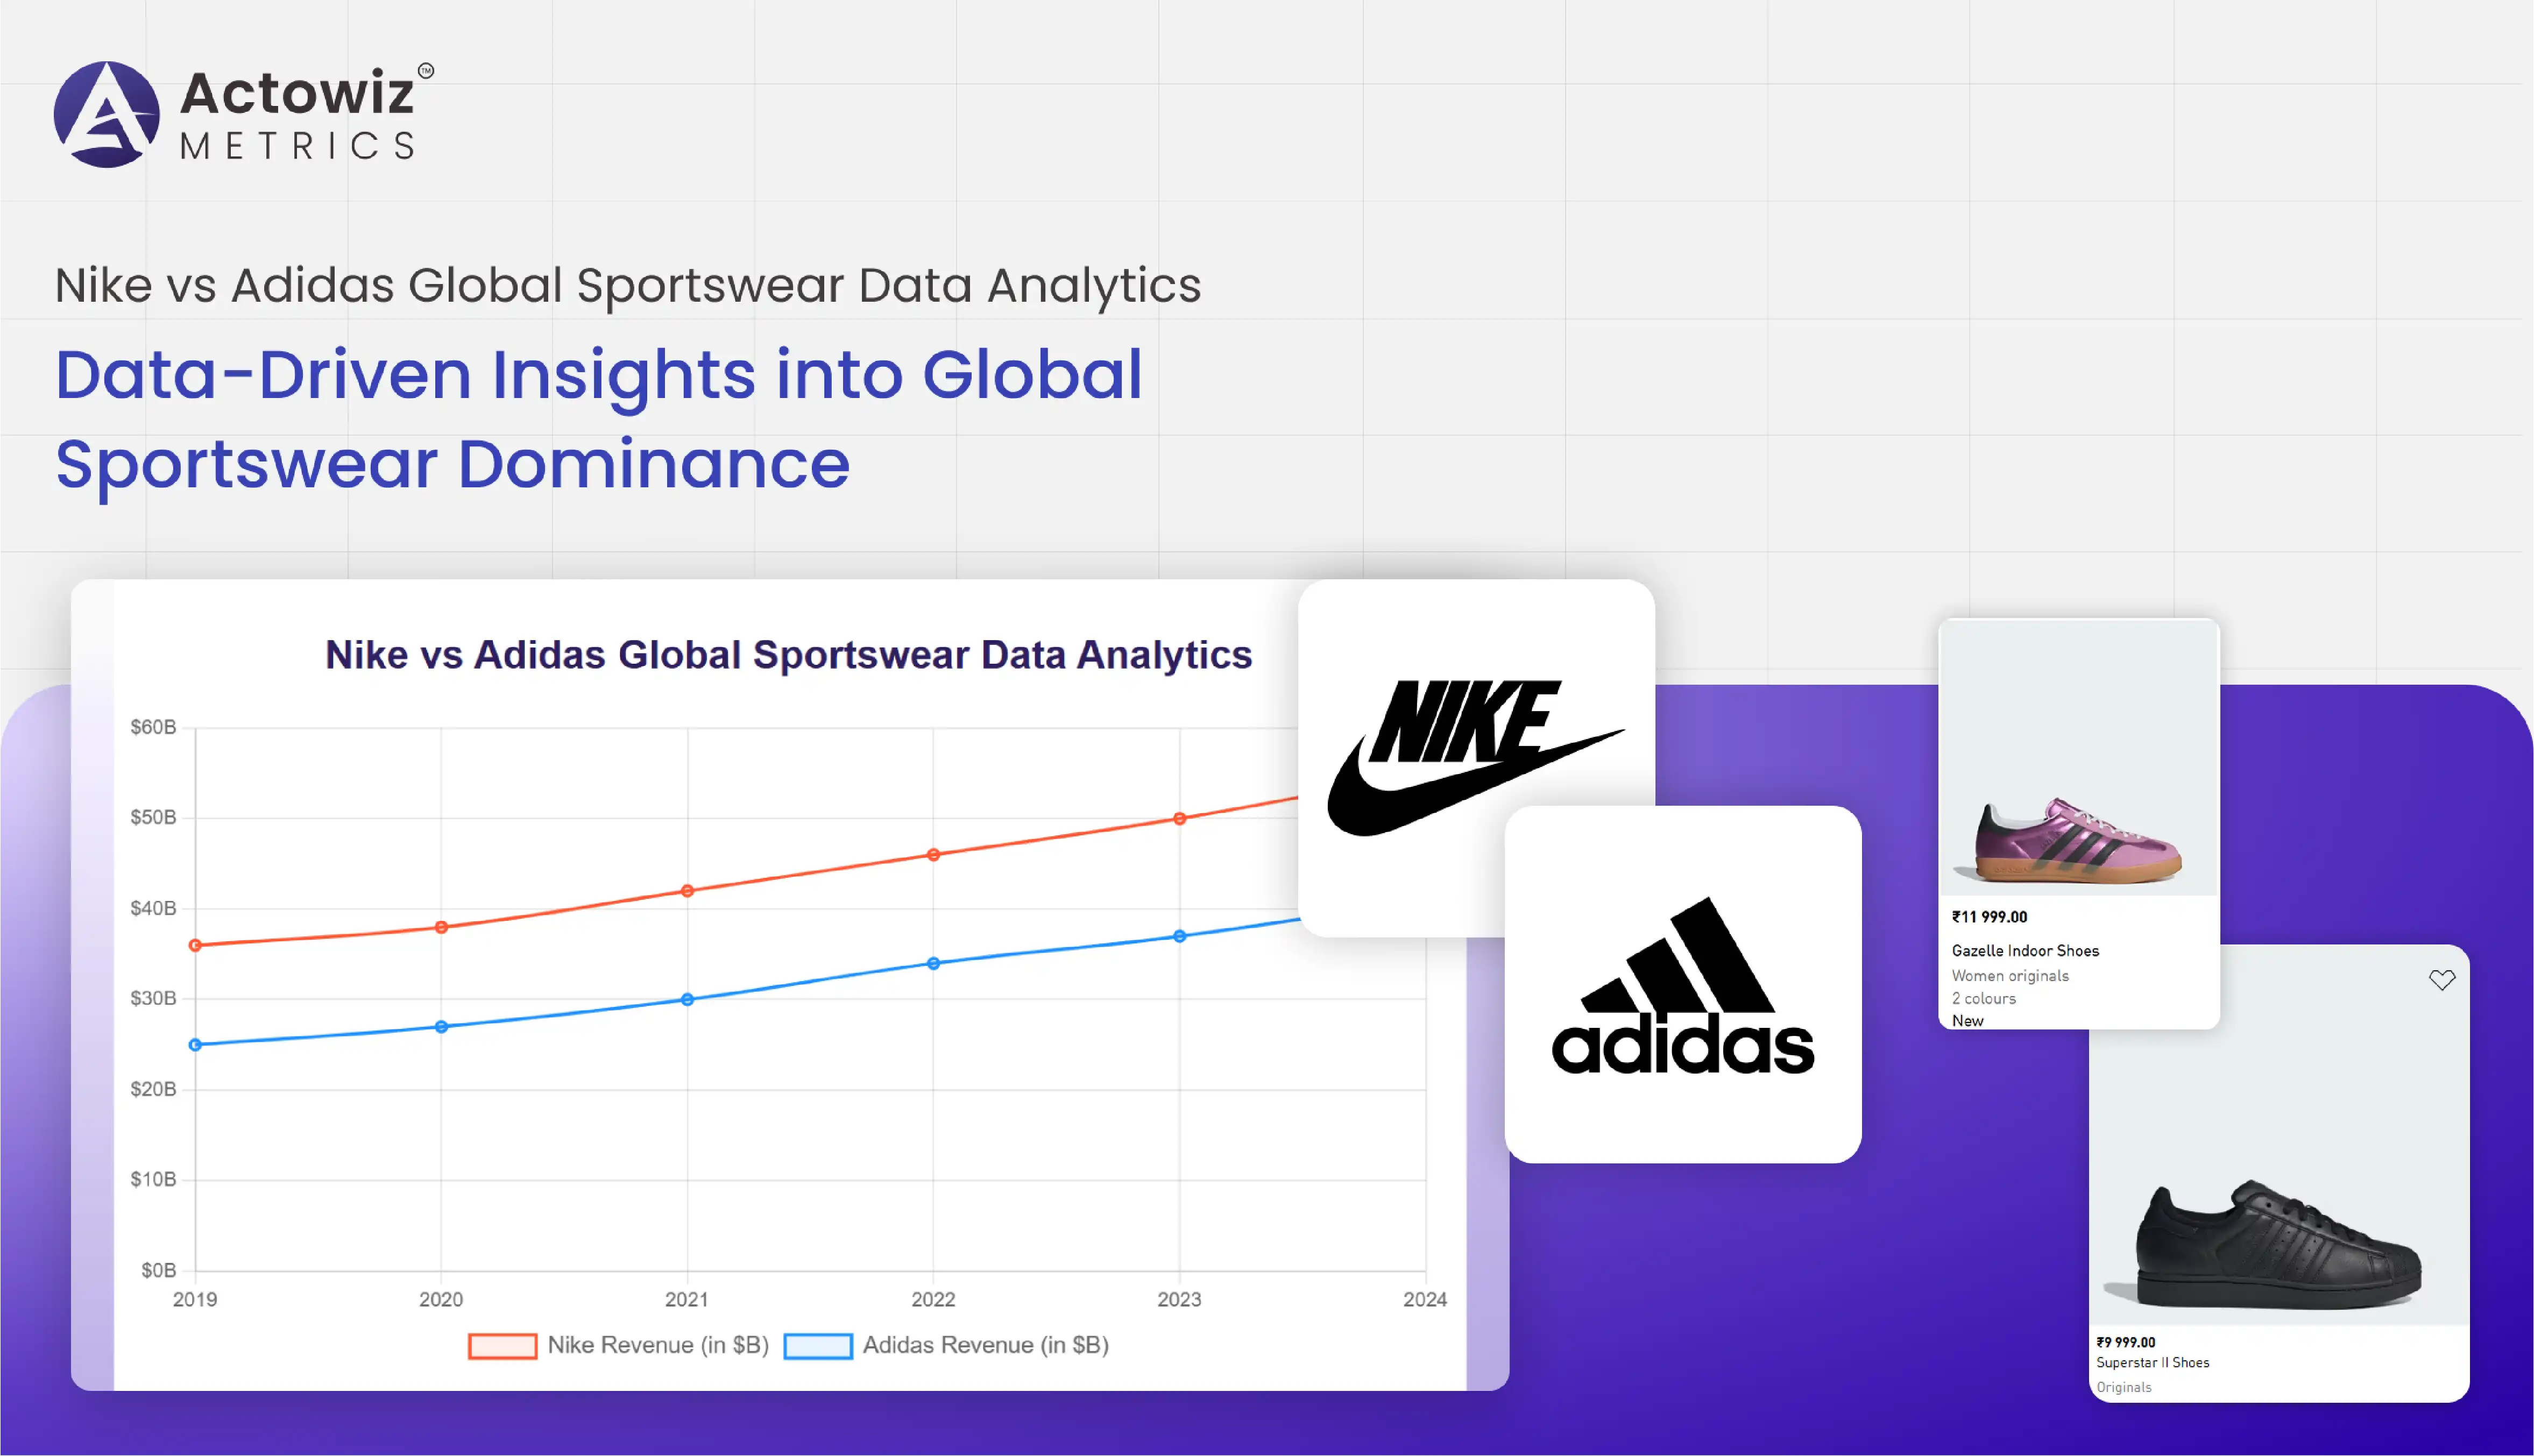
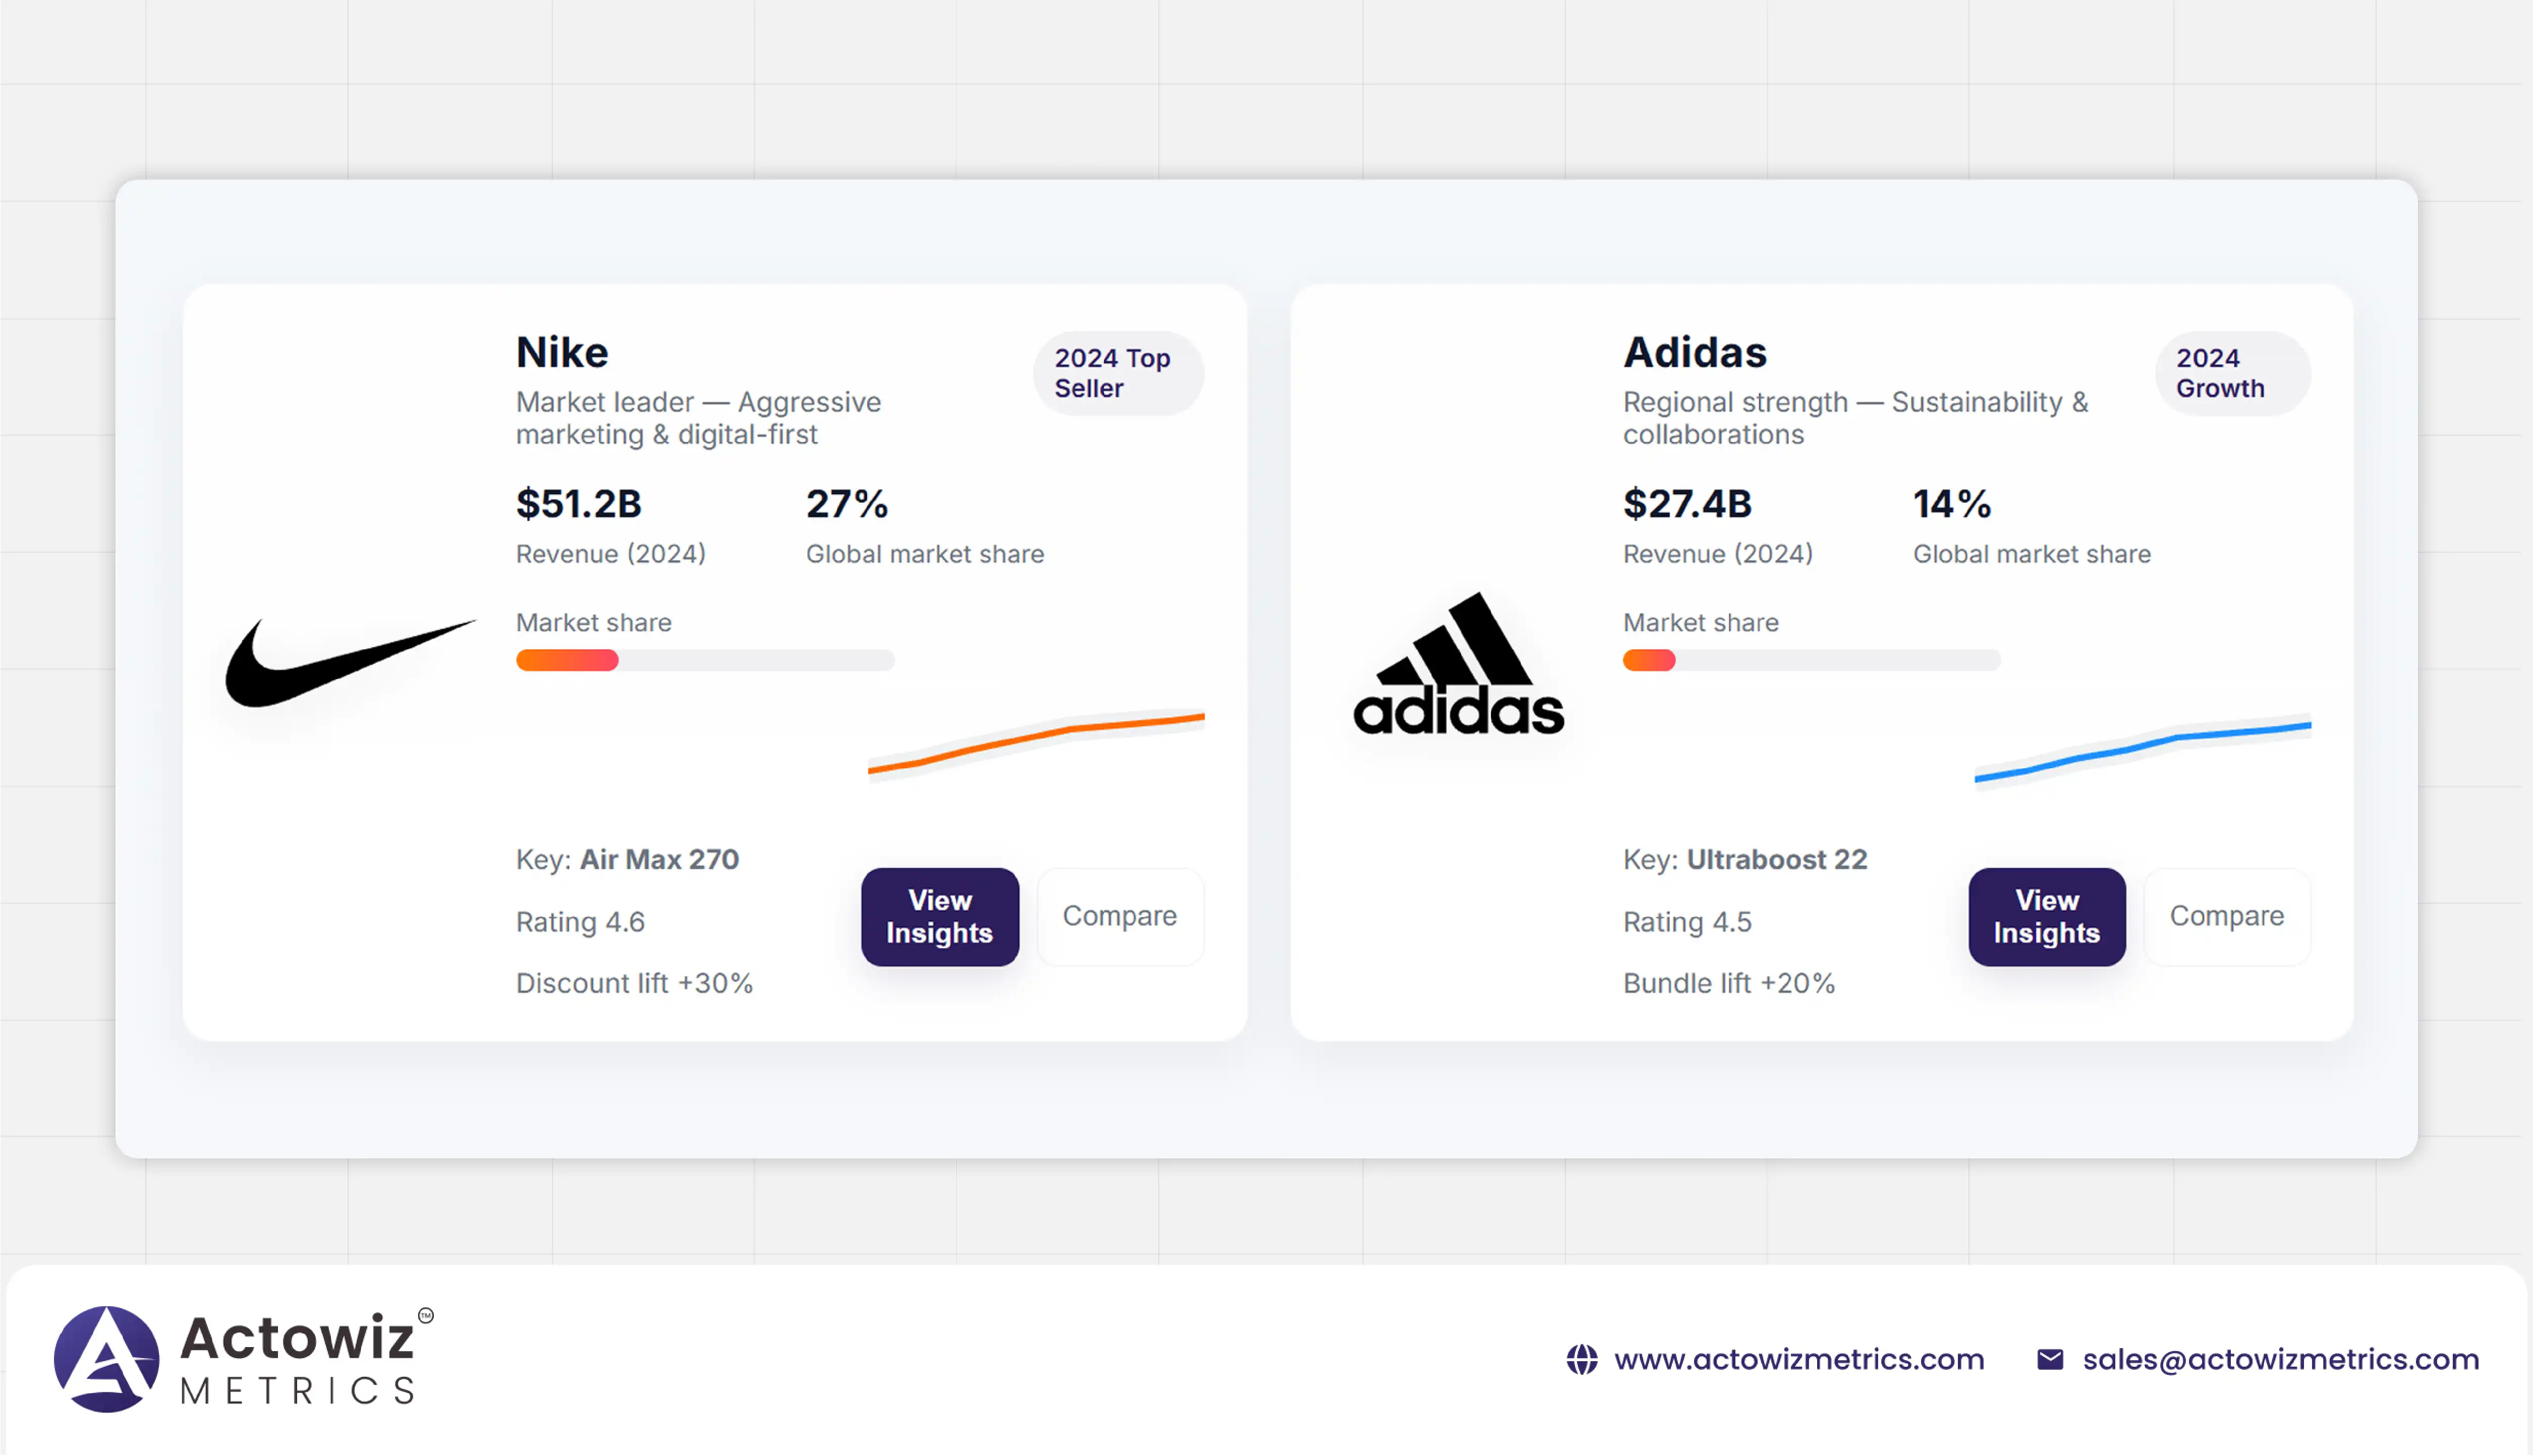
The global sportswear market continues to experience robust growth, fueled by increasing health consciousness, athleisure trends, and digital retail expansion. Leveraging Nike vs Adidas Global Sportswear Data Analytics, this section identifies key drivers behind the dominance of these brands. Nike remains the market leader in revenue, with $51.2 billion in 2024, commanding a 27% share, while Adidas generated $27.4 billion, representing 14% of the global market. The dominance of Nike is driven by its aggressive marketing, expansive product portfolio, and continuous innovation in footwear and apparel. Adidas, on the other hand, leverages its sustainability initiatives and premium collaborations to capture niche markets, particularly in Europe and Asia.
Scraping Nike vs Adidas Market Trends highlights shifts in consumer preference toward eco-friendly products, limited editions, and digitally integrated experiences. Nike’s strong digital presence and omnichannel strategy ensure high engagement across e-commerce and retail platforms, whereas Adidas focuses on regional market penetration, enhancing its appeal through localized campaigns. Using Nike vs Adidas Global Sportswear Data Analytics, the market overview provides actionable insights for stakeholders seeking to optimize product strategies and allocate resources effectively in a highly competitive landscape
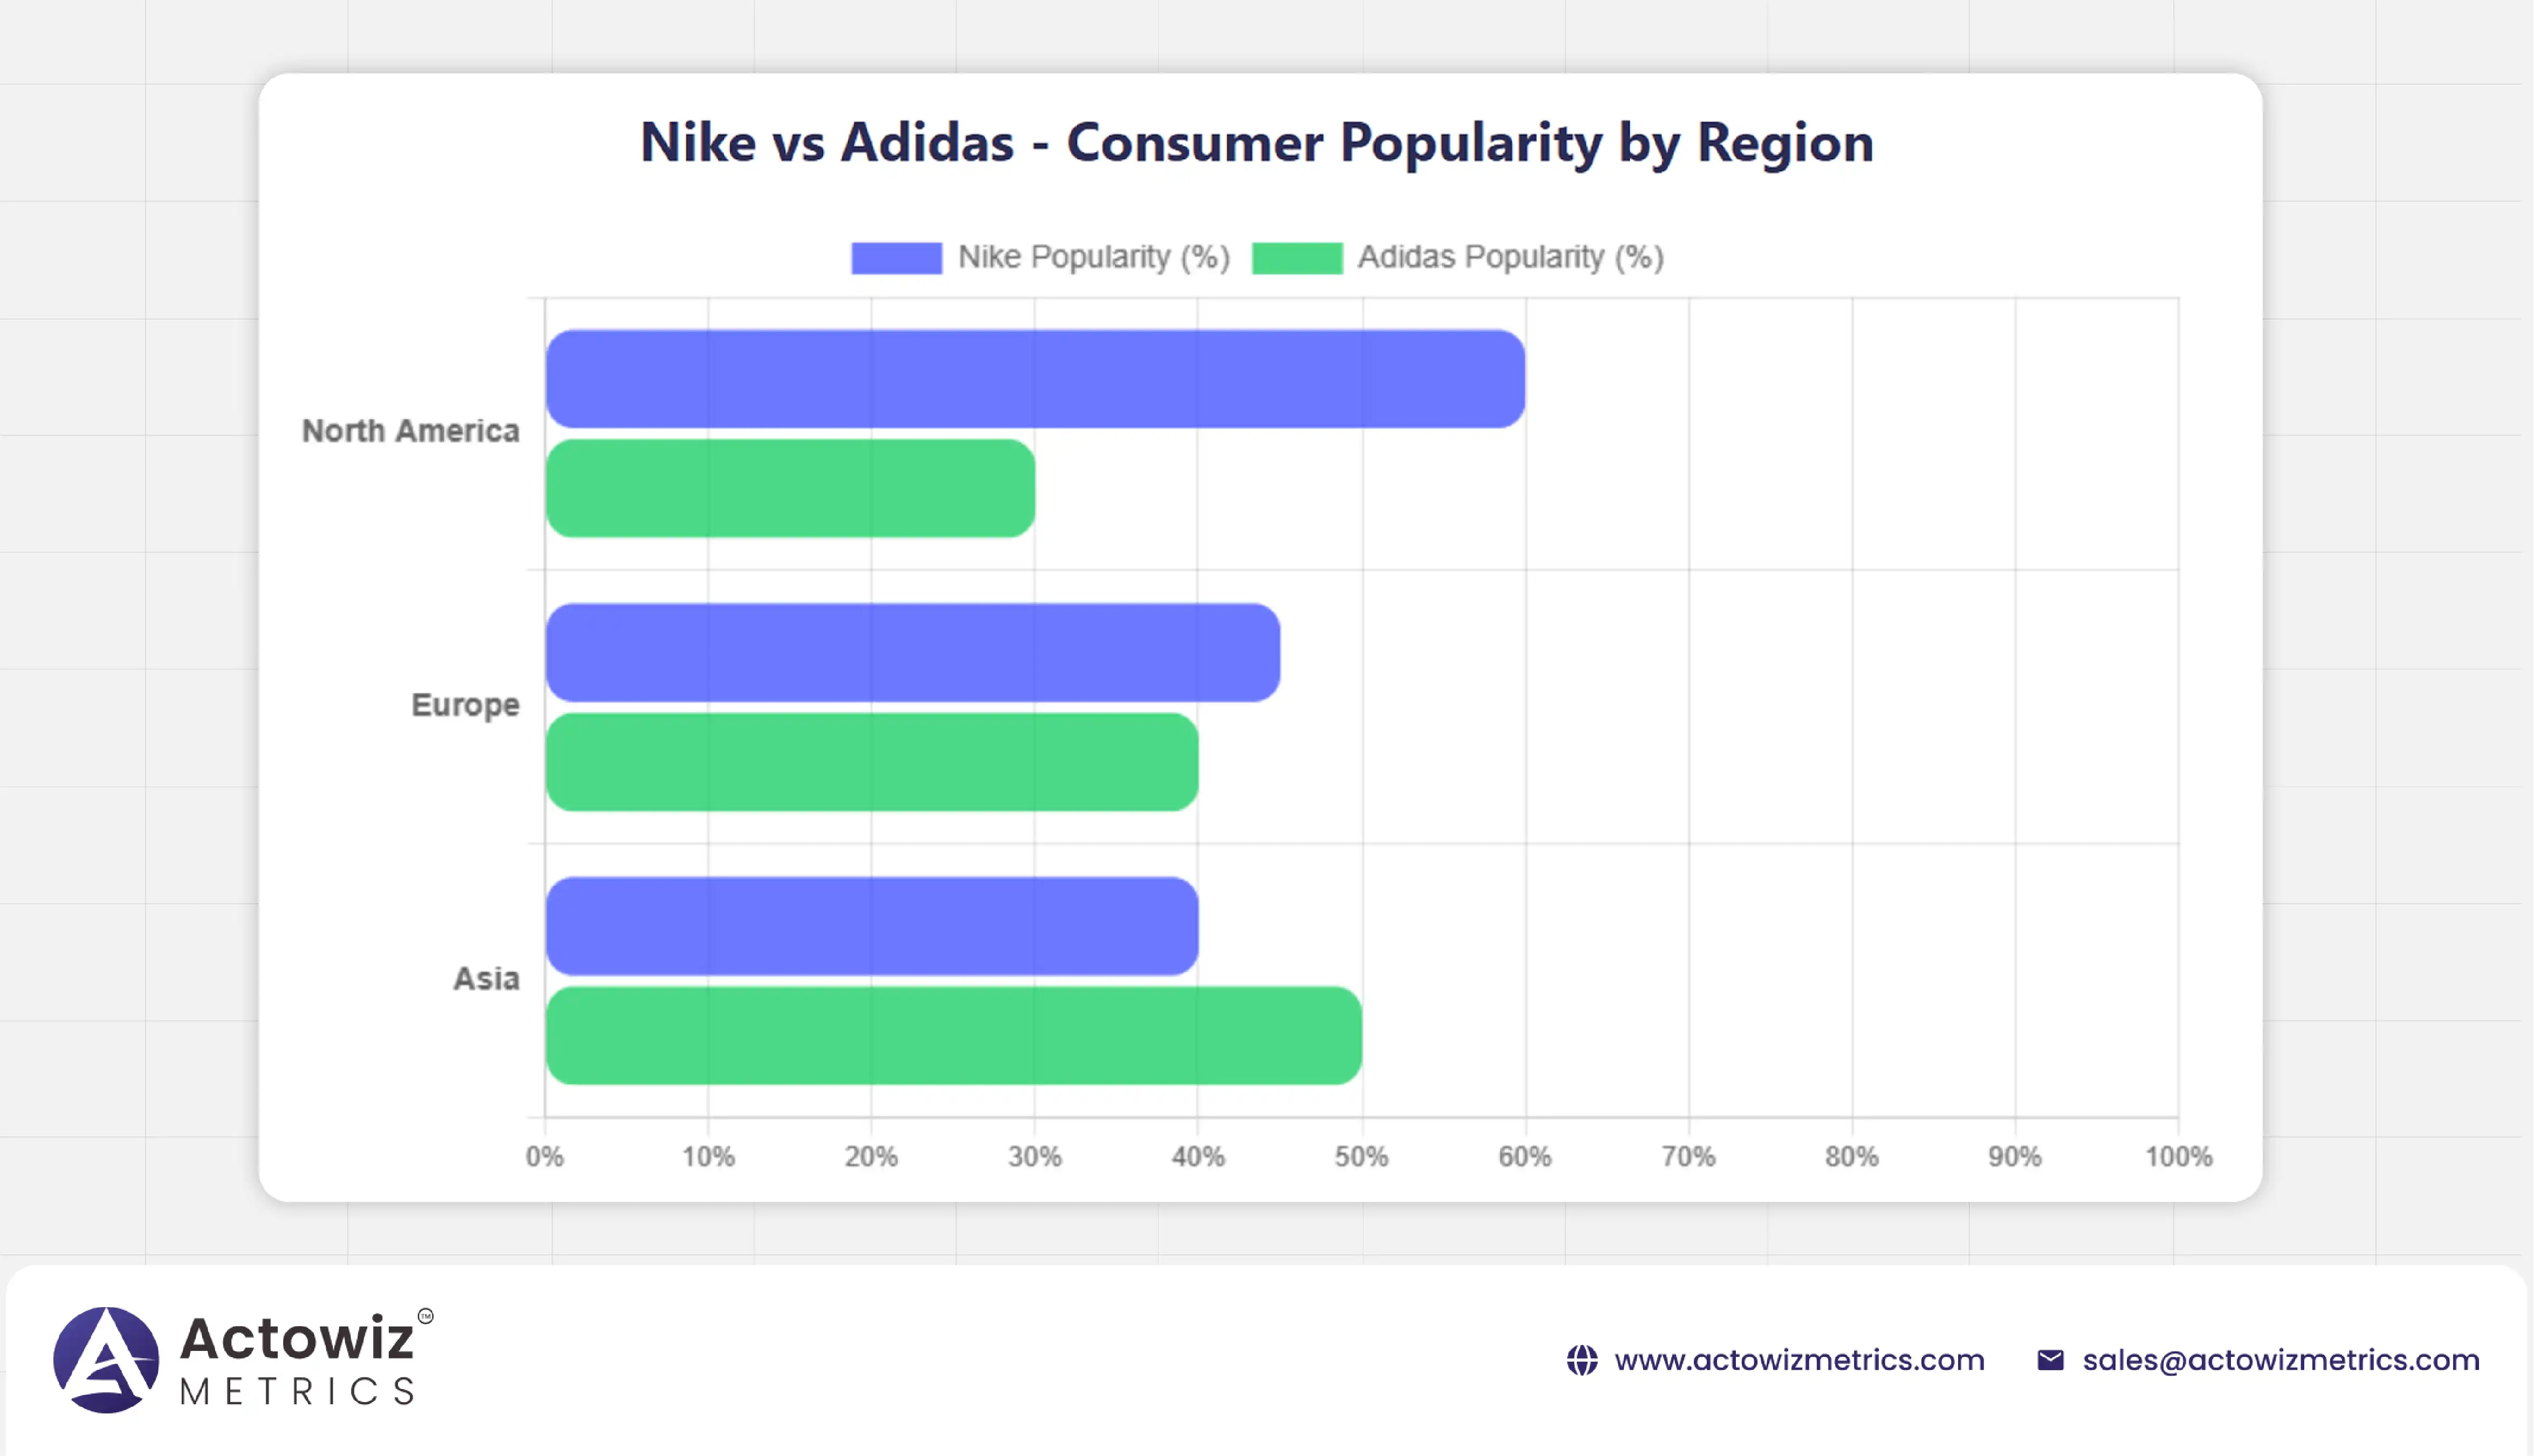
Understanding consumer behavior is critical for global sportswear brands. By integrating Adidas Consumer Buying Behavior Analysis and insights from Nike vs Adidas Global Sportswear Data Analytics, we can dissect purchasing trends, preferences, and demographic influences. In North America, Nike maintains a 60% popularity rate, outperforming Adidas, whose adoption is 30%. In Europe, Adidas closes the gap with 40% preference, compared to Nike’s 45%, driven by strong apparel sales and sustainable product offerings. In Asia, Adidas emerges as the leader with 50% popularity due to localized campaigns, innovative product designs, and collaborations with regional influencers.
Analysis of Nike & Adidas ecommerce data analytics reveals that consumers increasingly favor digital-first shopping experiences. Products with positive ratings, strong social media visibility, and effective promotional campaigns perform best. Extract Nike Top-Selling SKUs Data shows high sales volume for signature models like Air Max, while Adidas’ Ultraboost series thrives among trend-conscious shoppers. This section emphasizes how behavioral analytics can guide marketing, inventory, and product innovation strategies, ensuring brands remain agile in meeting evolving consumer demands and maximizing engagement across global markets.
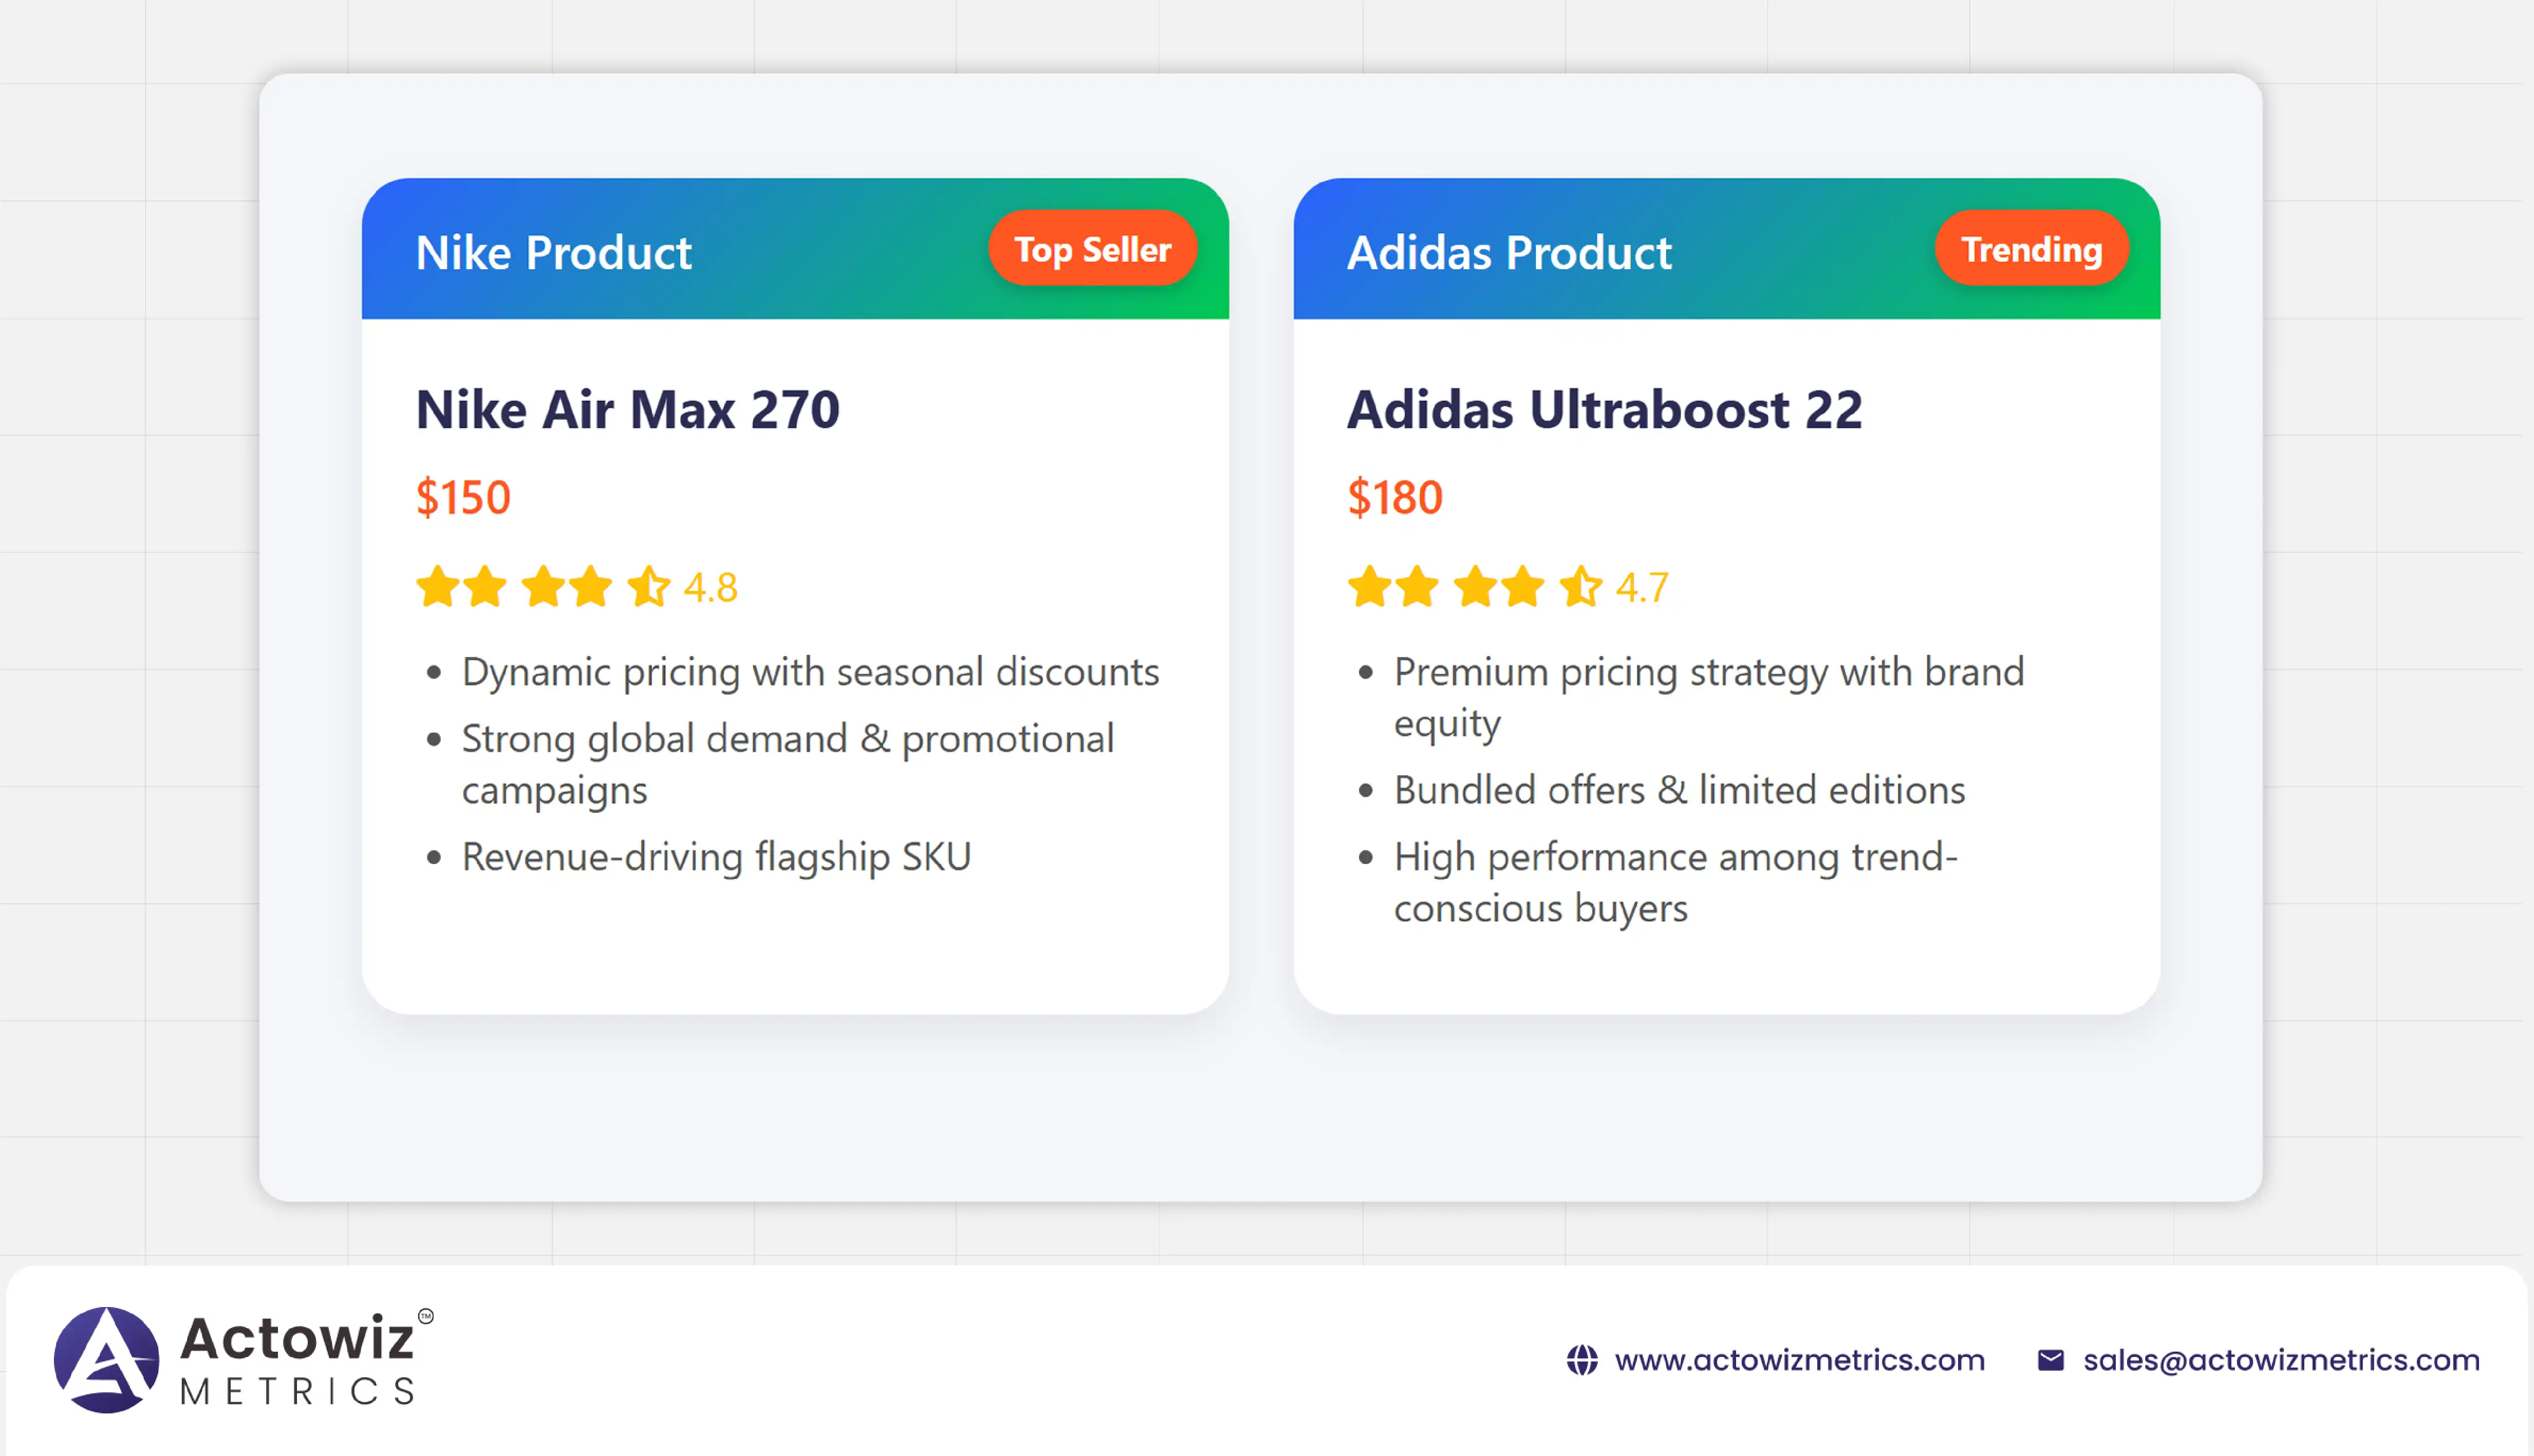
Through Nike & Adidas product ranking Analysis and Extract Adidas Sportswear Pricing Data, brands can identify top-performing SKUs, optimal pricing strategies, and revenue-driving categories. Nike’s Air Max 270 ($150) and Adidas’ Ultraboost 22 ($180) lead in sales volume, with ratings of 4.8 and 4.7, respectively. These insights reveal how premium pricing, combined with brand reputation and promotional campaigns, influences purchasing behavior.
Using Nike vs Adidas Global Sportswear Data Analytics, pricing analysis highlights regional variations. Nike consistently applies dynamic pricing and targeted discounts, supported by Nike promotions monitoring software, boosting sales during peak seasons. Adidas strategically bundles products and launches limited editions to maintain brand equity while sustaining demand. Competitor price comparisons, combined with SKU performance, offer actionable intelligence for inventory planning and sales forecasting.
Global sportswear brands analytics shows that aligning product ranking with pricing strategies maximizes revenue without compromising brand perception. Both Nike and Adidas leverage analytics to monitor market trends, optimize their portfolios, and enhance product visibility, demonstrating how data-driven decisions underpin market leadership and profitability.
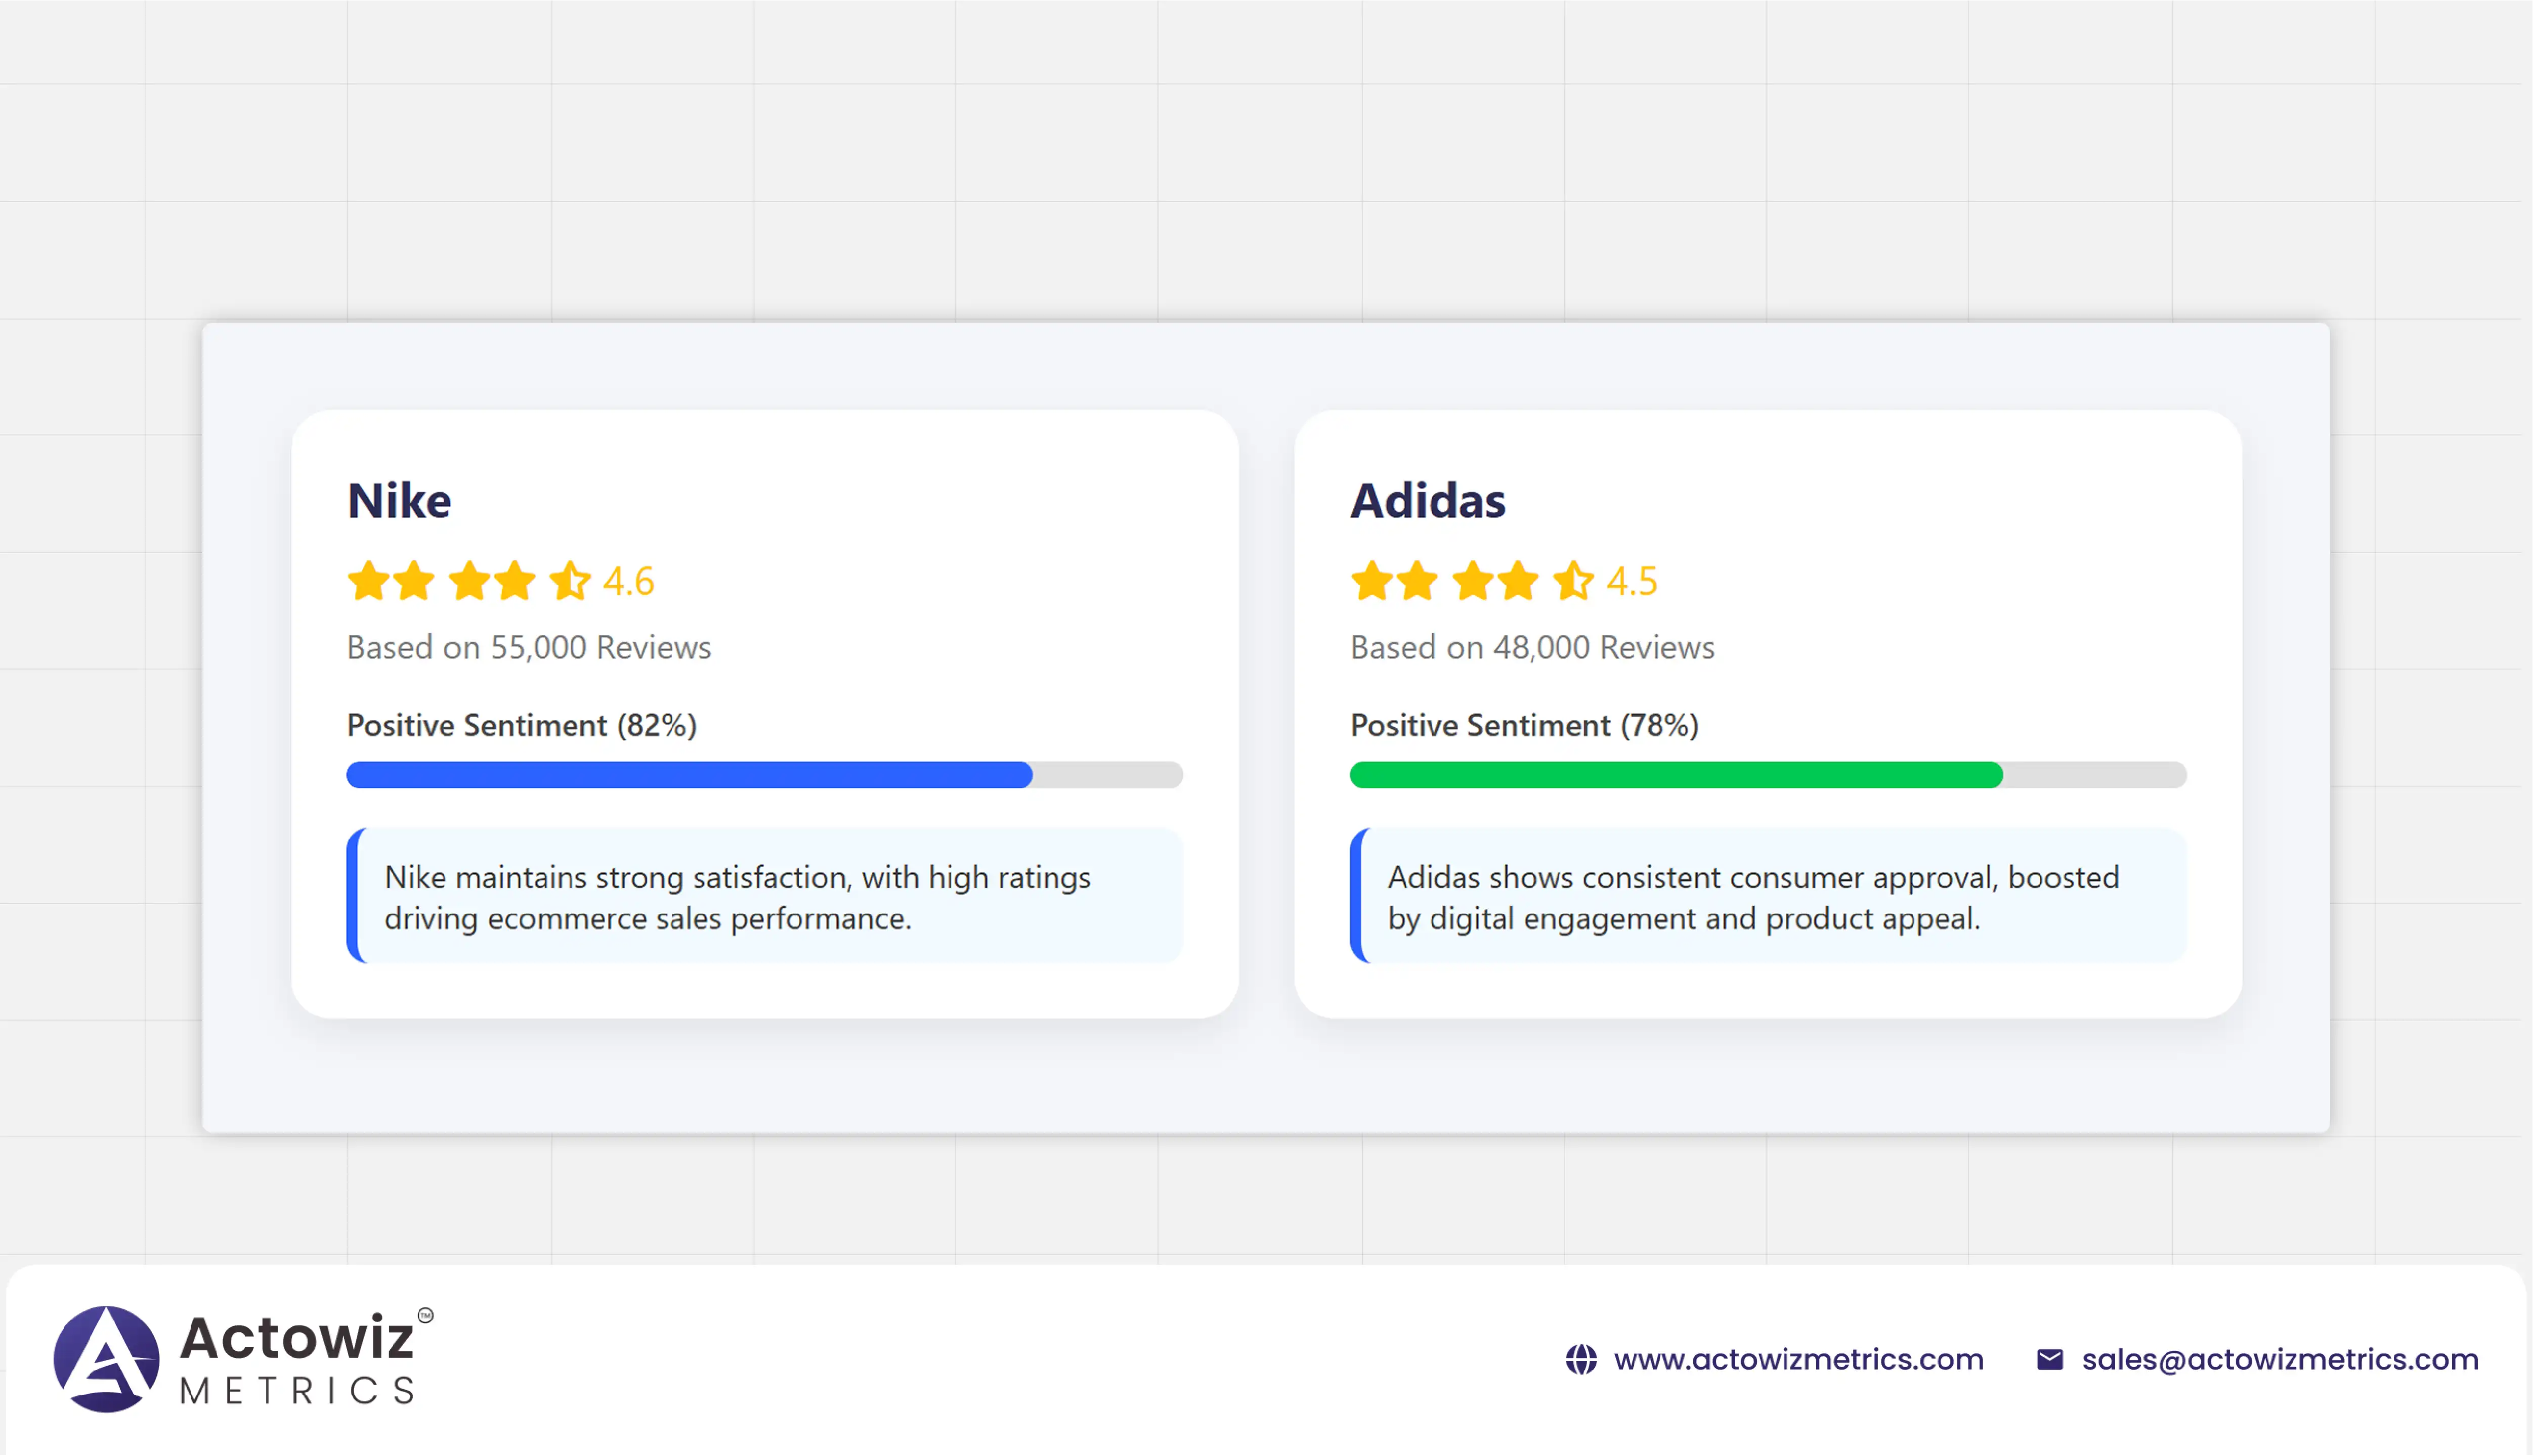
Consumer feedback, ratings, and online engagement are crucial for sustained success. Utilizing Nike & Adidas ratings scraping tool alongside Nike & Adidas ecommerce data analytics, we observed that high ratings directly correlate with sales performance. Nike averages a 4.6 rating from 55,000 reviews, while Adidas achieves 4.5 from 48,000 reviews. Positive sentiment percentages are 82% and 78%, respectively, highlighting strong consumer satisfaction for both brands.
Nike vs Adidas Global Sportswear Data Analytics shows that reviews influence purchase decisions and SEO rankings on e-commerce platforms. Products with higher ratings and frequent mentions on social media outperform others in both sales volume and brand visibility. By continuously monitoring ratings, brands can identify quality issues, optimize product features, and fine-tune marketing campaigns. This section underscores the importance of leveraging analytics to improve customer experience, inform inventory decisions, and predict trends in digital marketplaces, ensuring sustained engagement and loyalty across global audiences.
Analyzing top-selling products and promotional activities provides insights into revenue optimization. Using Extract Nike Top-Selling SKUs Data and Nike promotions monitoring software , Nike’s Air Max 270 achieved a 30% sales lift through targeted discounts and digital ad campaigns. Adidas’ Ultraboost 22 saw a 20% uplift with bundle offers and seasonal campaigns.
Nike vs Adidas Global Sportswear Data Analytics enables brands to identify which promotional strategies resonate most with different consumer segments. Data from the Nike & Adidas ratings scraping tool helps refine campaigns by linking promotions with customer feedback and ratings. SKU performance analysis allows inventory planning to match high-demand periods while minimizing overstock risks. This strategic approach demonstrates how data-driven decision-making strengthens market positioning, increases ROI, and ensures efficient allocation of marketing budgets for global sportswear brands.
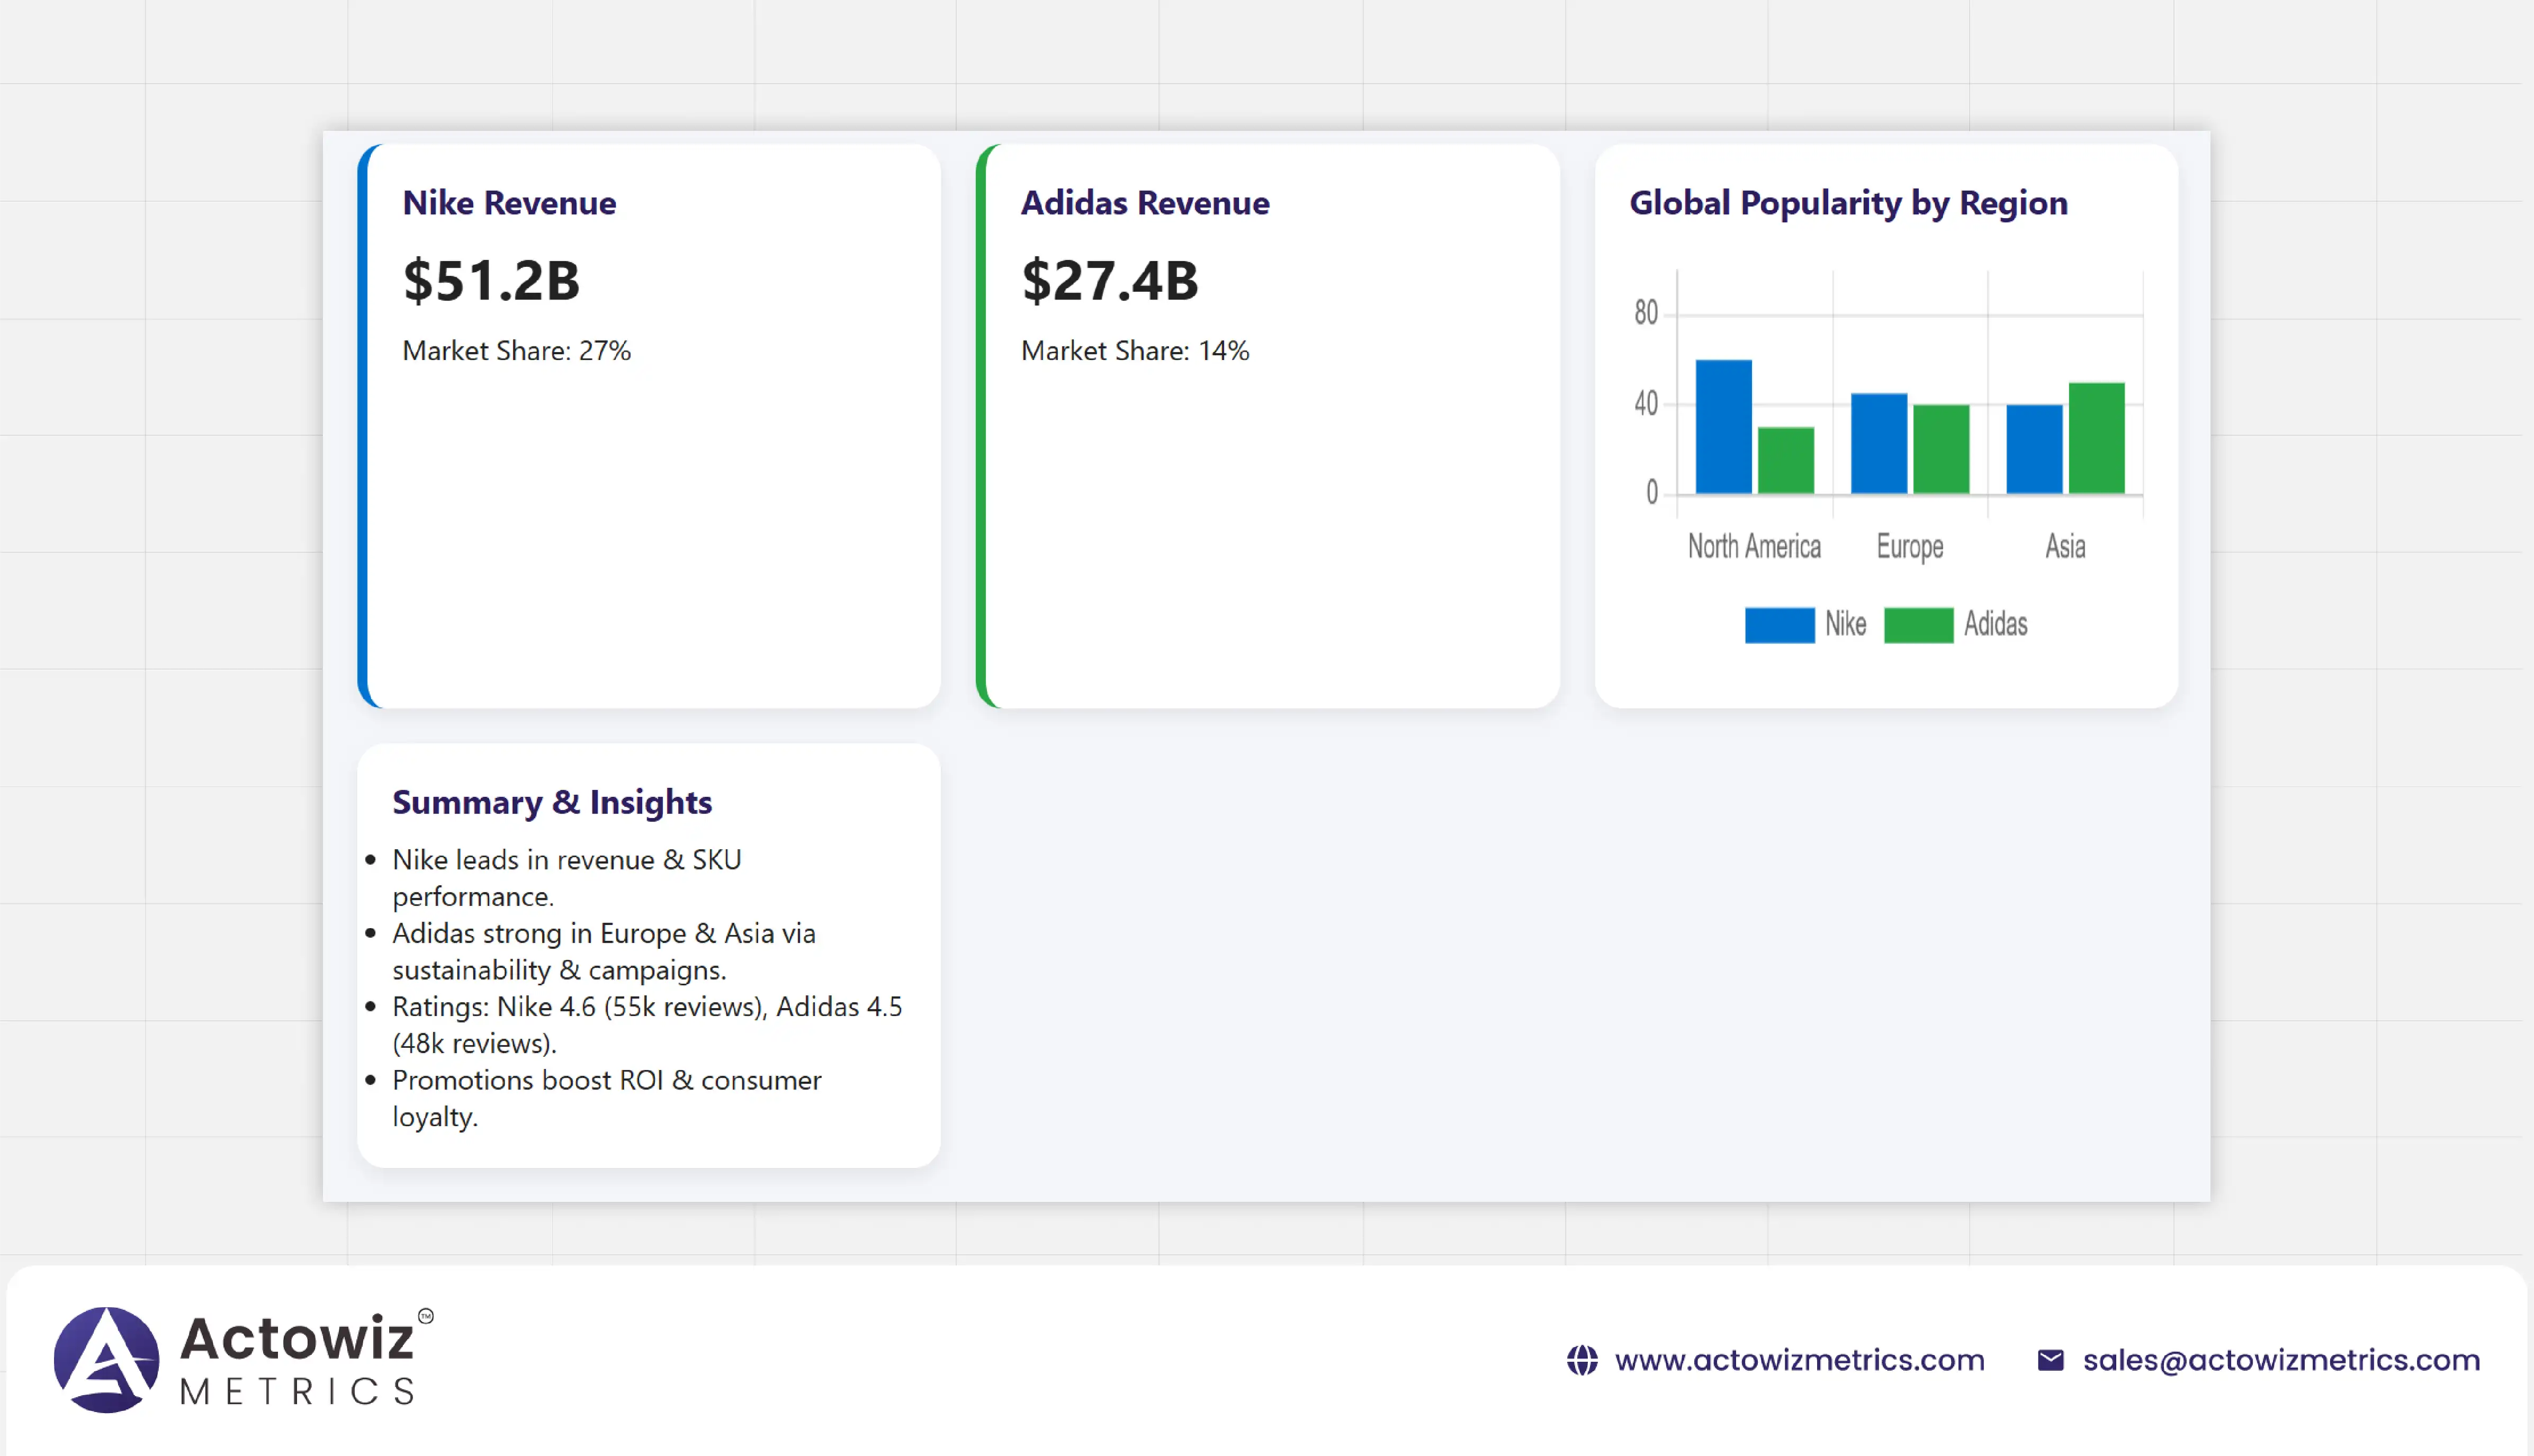
Leveraging Nike vs Adidas Global Sportswear Data Analytics reveals key insights: Nike leads in revenue, SKU performance, and promotional efficiency, while Adidas excels in regional adoption and sustainable innovation. Global sportswear brands analytics confirms the importance of continuous monitoring of ratings, pricing, and consumer behavior. Using Nike & Adidas ecommerce data analytics, brands can optimize campaigns, inventory, and product offerings, maximizing market penetration and customer loyalty.
Nike vs Adidas Global Sportswear Data Analytics empowers brands to extract Nike Top-Selling SKUs Data, monitor promotions, and track market trends for strategic decision-making. By integrating analytics into daily operations, brands gain a competitive edge in a rapidly evolving sportswear market.
Actowiz Metrics’ comprehensive Nike vs Adidas Global Sportswear Data Analytics equips brands with actionable insights to outperform competitors. From Nike & Adidas product ranking Analysis to ratings scraping and pricing data extraction, businesses can optimize operations and drive revenue growth.
Unlock the power of data-driven sportswear analytics—partner with Actowiz Metrics to transform insights into strategic success and market leadership
Expert blogs, research reports and infographics — practical, data-driven reading across e-commerce and quick-commerce.
Most fields are optional — the more you share, the better your sample.


.webp "infographics")
.webp "infographics")


