Create your own


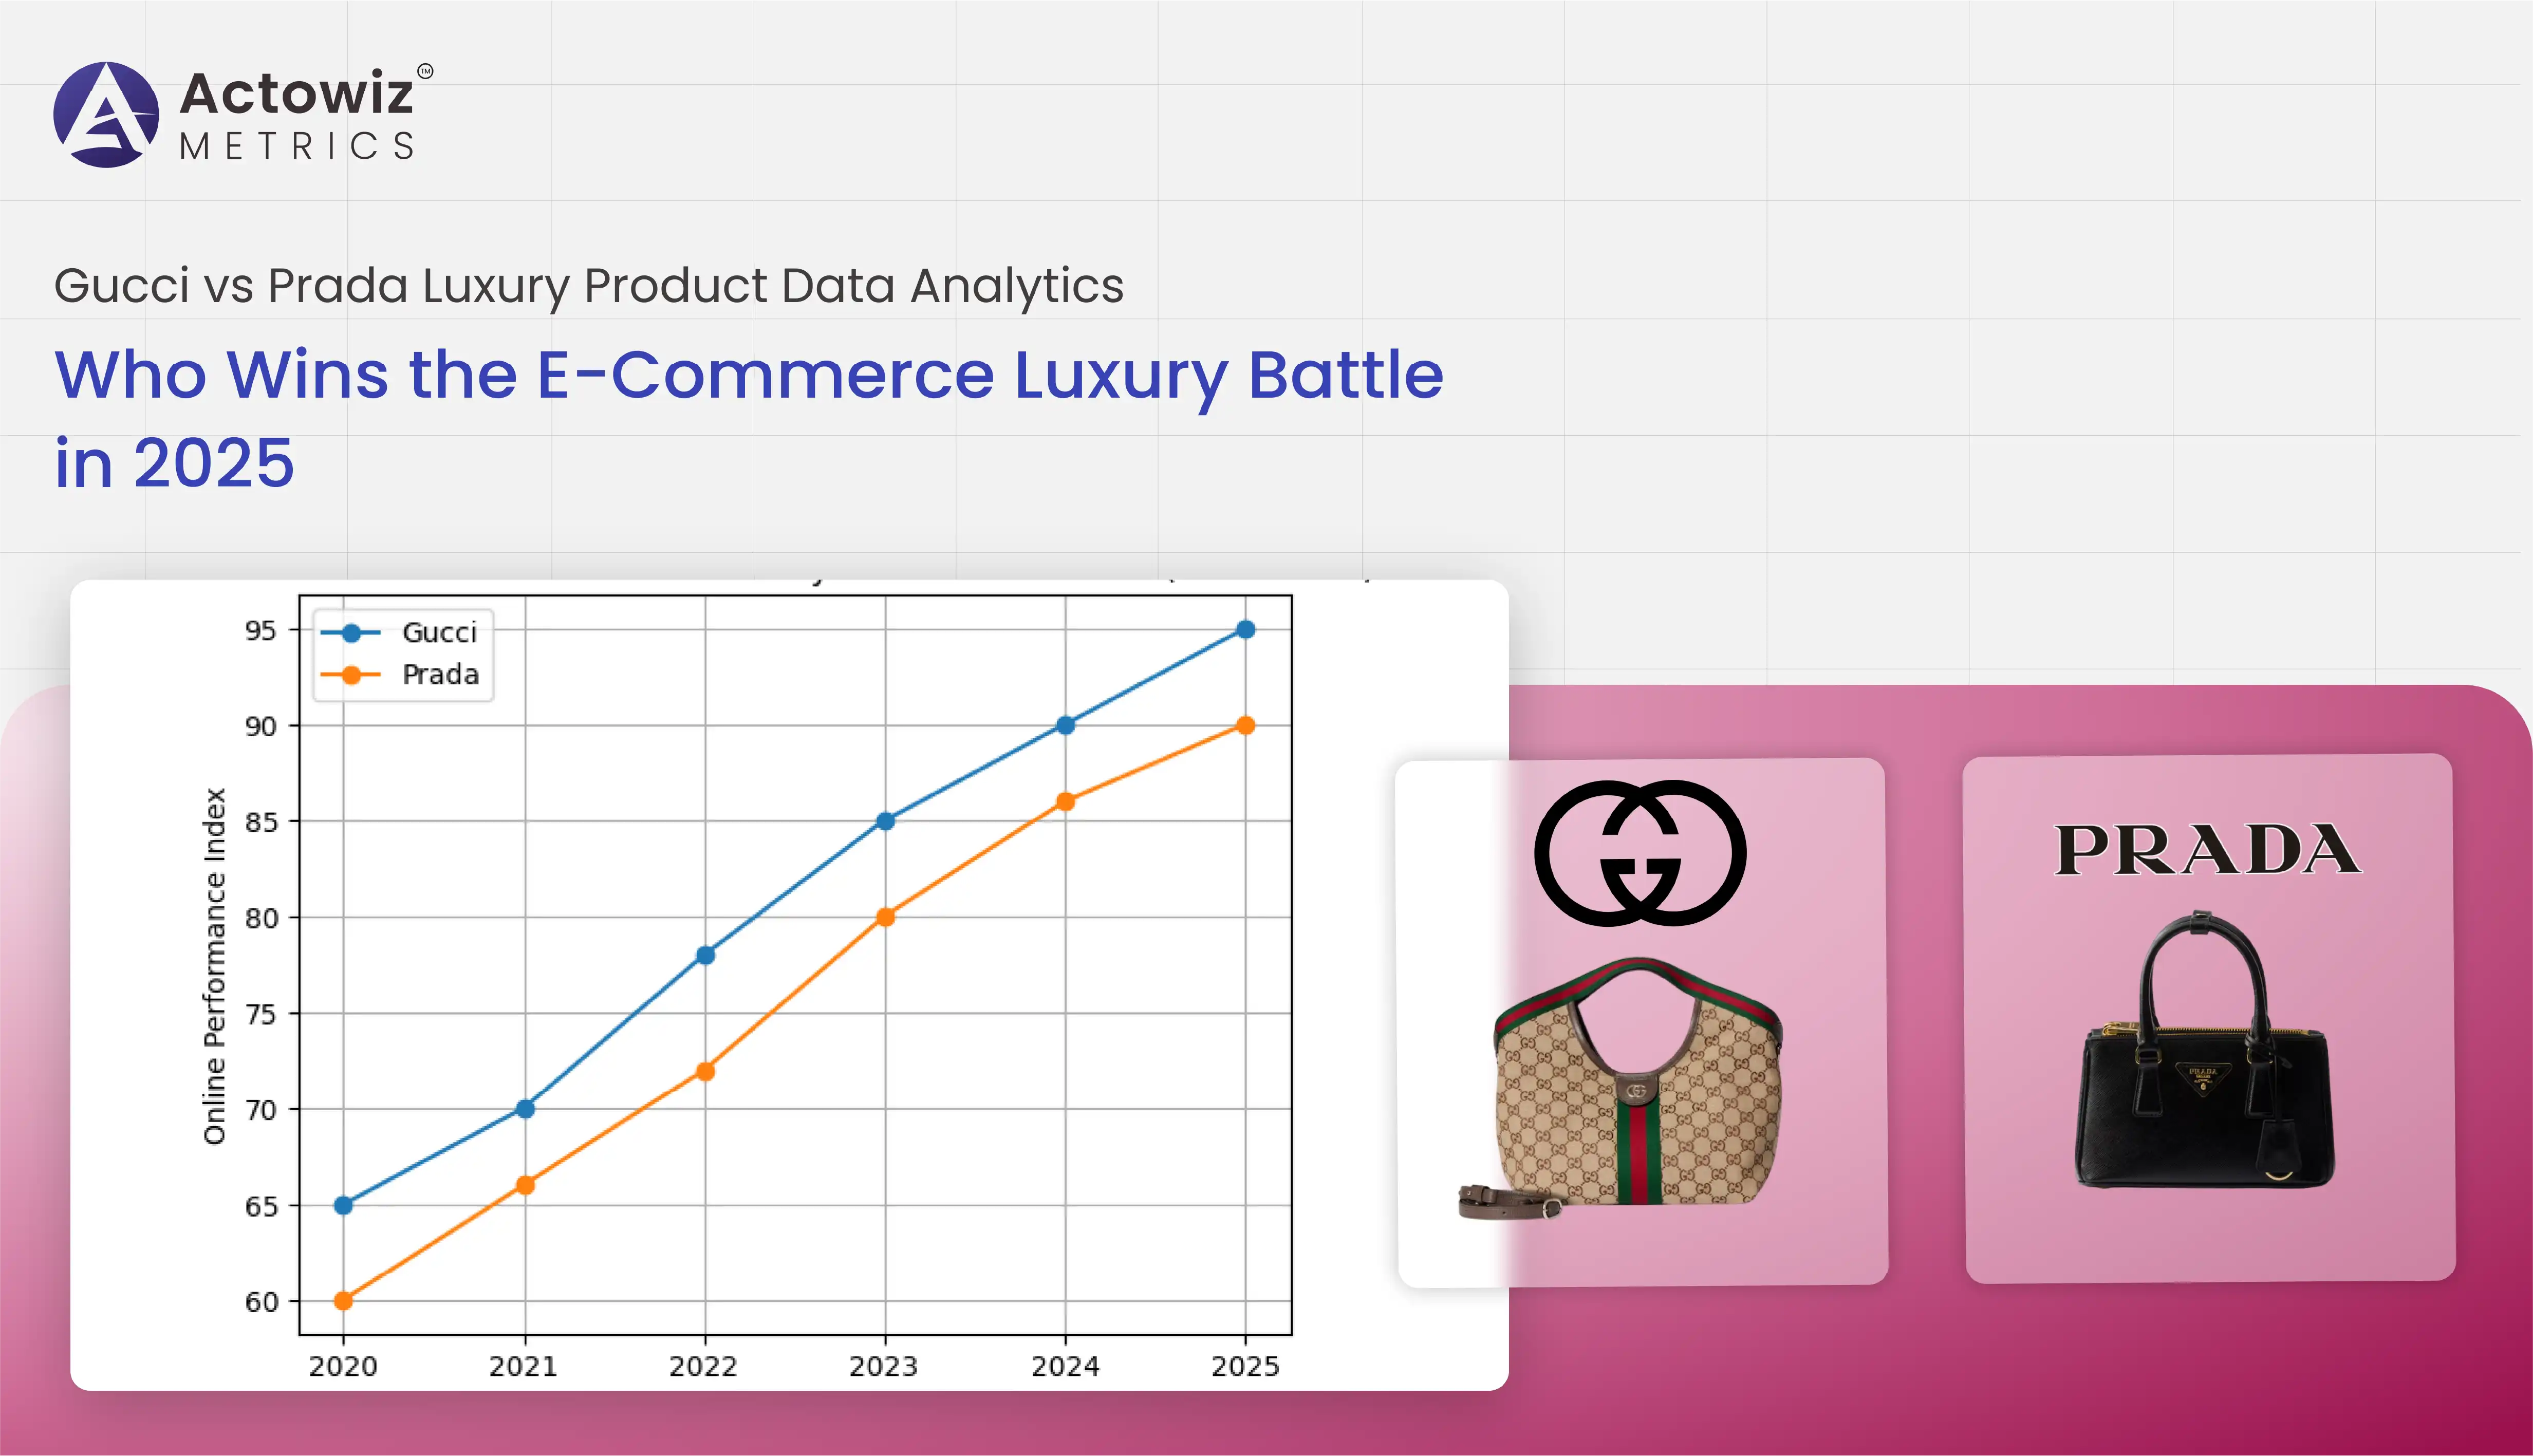
In the evolving landscape of e-commerce luxury retail, brands are leveraging data to optimize pricing, product assortment, and digital visibility. This report utilizes Gucci vs Prada Luxury Product Data Analytics to evaluate how these iconic brands compete online in 2025. Using Actowiz Metrics’ robust E-commerce Analytics, the study examines historical trends (2020–2025) across product categories, pricing strategies, sales performance, and digital shelf presence. The aim is to provide actionable insights for marketers, pricing teams, and retail analysts seeking to understand competitive dynamics and optimize strategies in the luxury sector.
Actowiz Metrics leveraged the Gucci vs Prada Luxury Insights Data Scraper, Digital Shelf Analytics tools to extract and analyze detailed product and pricing data from online retail channels. Across 500+ SKUs, the study tracks pricing patterns, promotion frequency, and stock availability.
| Year | Gucci | Prada | Avg Difference (%) |
|---|---|---|---|
| 2020 | 1,250 | 1,180 | 5.9% |
| 2021 | 1,310 | 1,225 | 6.9% |
| 2022 | 1,420 | 1,310 | 8.4% |
| 2023 | 1,395 | 1,340 | 4.1% |
| 2024 | 1,480 | 1,415 | 4.6% |
| 2025 | 1,510 | 1,445 | 4.5% |
Analysis shows Gucci consistently maintaining a higher average price point. Digital shelf metrics reveal Prada has higher SKU availability but fewer seasonal promotions compared to Gucci, suggesting a premium positioning strategy focused on exclusivity.
This section explores E-Commerce Products Trend Analytics from Gucci vs Prada by tracking customer engagement, best-selling SKUs, and category-level shifts over five years.
| Year | Gucci Top Category | Prada Top Category |
|---|---|---|
| 2020 | Handbags | Footwear |
| 2021 | Sneakers | Handbags |
| 2022 | Accessories | Bags |
| 2023 | Footwear | Accessories |
| 2024 | Handbags | Sneakers |
| 2025 | Handbags | Handbags |
Trends indicate Gucci consistently performs strongly in handbags, while Prada shows fluctuations in category dominance. Using e-commerce trend analytics, Actowiz Metrics identifies promotional patterns, revealing Gucci’s seasonal collection launches drive higher engagement. Prada’s strategy prioritizes limited edition drops, resulting in sporadic spikes in sales and web traffic.
Through Extract Gucci vs Prada Luxury Product Data, Price Benchmarking, the report examines relative pricing across SKUs, identifying competitive gaps and discount trends.
| Year | Gucci Avg Discount (%) | Prada Avg Discount (%) |
|---|---|---|
| 2020 | 8 | 5 |
| 2021 | 10 | 7 |
| 2022 | 9 | 6 |
| 2023 | 12 | 8 |
| 2024 | 10 | 7 |
| 2025 | 11 | 9 |
Data shows Gucci uses higher discount frequency in online outlets to boost seasonal sales, whereas Prada maintains tighter pricing to reinforce exclusivity. Benchmarking across multiple platforms highlights Prada’s premium image and Gucci’s blend of accessibility with luxury.
Using Gucci vs Prada Real-Time Market Data Intelligence, Actowiz Metrics tracked SKU availability, flash sales, and web traffic performance.
| Platform | Gucci | Prada |
|---|---|---|
| Official Site | 15 | 12 |
| Multi-Brand Retailers | 20 | 18 |
| Luxury Marketplaces | 12 | 14 |
Real-time intelligence indicates Gucci updates its digital shelf more aggressively, responding to competitor promotions and market demand faster than Prada. Prada’s slower refresh cycle emphasizes curated collections, aligning with brand exclusivity.
Through E-Commerce Price Benchmarking: Gucci vs Prada, the report measures SKU pricing across global online marketplaces.
| Product Type | Gucci | Prada | Price Gap (%) |
|---|---|---|---|
| Handbags | 2,100 | 1,950 | 7.7 |
| Shoes | 1,300 | 1,240 | 4.8 |
| Accessories | 720 | 680 | 5.9 |
Benchmarking shows Gucci consistently commands a price premium across categories, but Prada leverages selective availability to maintain brand perception. The analysis provides actionable insights for pricing teams, highlighting where margin optimization is possible without diluting brand equity.
The Gucci Best Selling Brands Analytics, Brand Competition Analysis evaluates market share, sales velocity, and top-performing SKUs across e-commerce platforms.
| Rank | Gucci SKU | Prada SKU | Units Sold |
|---|---|---|---|
| 1 | GG Handbag | Cahier Bag | 1,250 |
| 2 | Ace Sneakers | Cloudbust Sneakers | 980 |
| 3 | GG Wallet | Sidonie Bag | 870 |
| 4 | Dionysus Bag | Cahier Wallet | 650 |
| 5 | GG Belt | Logo Sneakers | 500 |
Analysis indicates Gucci leads in high-volume SKUs, particularly handbags and sneakers. Prada relies on limited edition releases to maintain exclusivity, translating to lower unit volumes but higher perceived value. This competitive assessment informs launch planning, pricing strategies, and category investments.
Actowiz Metrics delivers actionable intelligence with Prada Best Selling Brands Analytics, Product Data Tracking, empowering luxury brands to benchmark performance, monitor competitor activity, and track digital shelf visibility. With high-frequency data extraction, real-time monitoring, and advanced analytics dashboards, we provide end-to-end e-commerce insights. Brands gain clarity on pricing trends, product assortment performance, and category-level market dynamics, enabling confident, data-backed decision-making for strategic growth and competitive advantage.
In 2025, the e-commerce luxury market is more competitive than ever. Using Gucci vs Prada Luxury Product Data Analytics, brands can identify gaps, optimize pricing, track competitor strategies, and enhance digital shelf performance. Actowiz Metrics provides structured, real-time insights to help brands adapt to dynamic consumer behavior, monitor trends, and make informed decisions that strengthen market position.
Unlock your luxury e-commerce insights with Actowiz Metrics today. Harness the power of comprehensive data analytics to outperform competitors in the digital luxury market!

Whatever your project size is, we will handle it well with all the standards fulfilled! We are here to give 100% satisfaction.
Any analytics feature you need — we provide it
24/7 global support
Real-time analytics dashboard
Full data transparency at every stage
Customized solutions to achieve your data analysis goals