BLOG


The Christmas gifting market has evolved into a highly data-driven ecosystem shaped by digital discovery, dynamic pricing, and fast-changing consumer preferences. This research report presents a comprehensive ranking of the most in-demand Christmas gifts using Top 100 Christmas Gifts 2025 Data Analytics, derived from over one million scraped product listings across global e-commerce platforms.
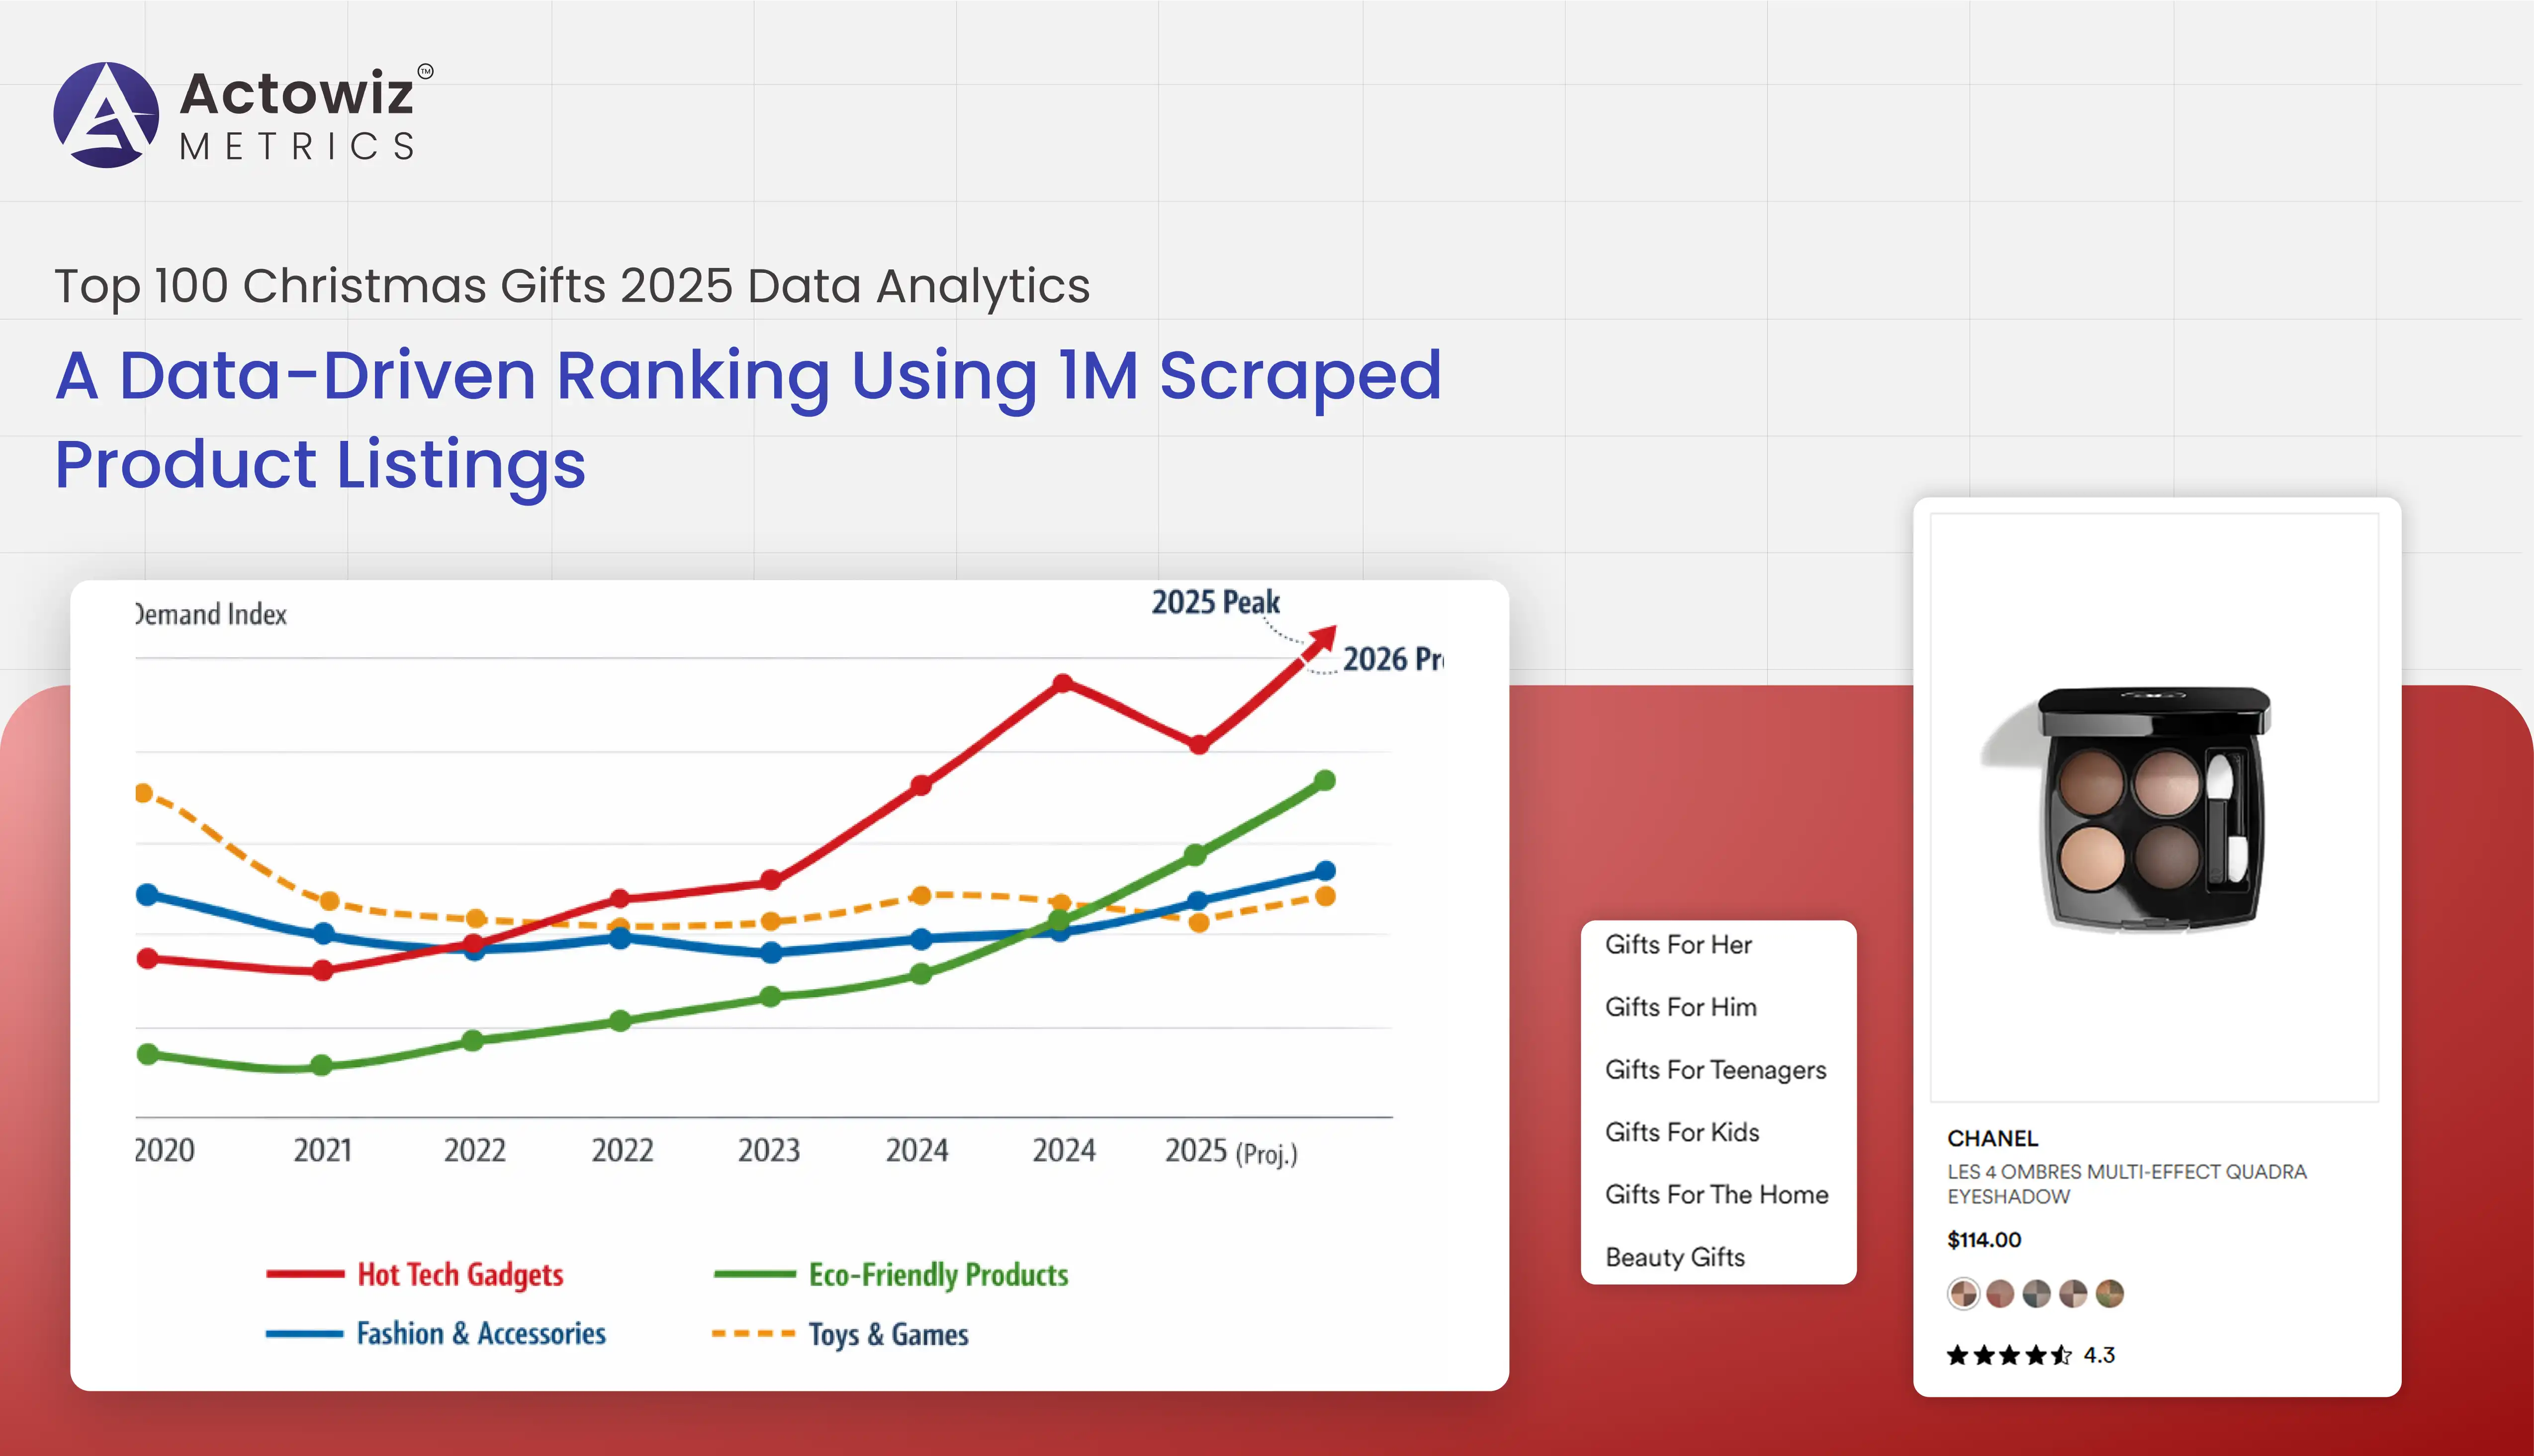
By combining large-scale Product Data Tracking with historical trend analysis, Actowiz Metrics identifies which product categories, price points, and brands consistently dominate festive shopping behavior. The study evaluates performance indicators such as sales velocity, price fluctuations, discount depth, availability, and consumer engagement signals from 2020 through projected trends in 2026. These insights help retailers, brands, and marketers anticipate demand, optimize assortments, and plan holiday strategies with precision rather than assumptions.
Understanding what consumers want starts with accurately capturing market signals. Using Scrape Top Christmas Gift Product Data 2025, Actowiz Metrics analyzed product visibility, ranking movements, and engagement metrics across electronics, toys, fashion, home, and personal accessories.
| Year | Listings Analyzed | Avg Price ($) | Top Category |
|---|---|---|---|
| 2020 | 420,000 | 38.20 | Toys |
| 2022 | 680,000 | 42.90 | Electronics |
| 2024 | 910,000 | 46.50 | Smart Devices |
| 2025 | 1,000,000 | 49.80 | Lifestyle Tech |
| 2026* | 1,150,000 | 52.10 | AI Gadgets |
The data shows a steady shift from traditional toys toward tech-enabled lifestyle products. Consumers increasingly prioritize utility, innovation, and personalization when selecting gifts. High-ranking products consistently maintain competitive pricing and strong availability, reinforcing the importance of demand-led inventory planning during peak festive periods.
Through Top Christmas Gift Trends Data Extraction 2025, Actowiz Metrics evaluated how gifting preferences evolved by category and price sensitivity.
| Category | Avg Rank (2020) | Avg Rank (2025) | Growth |
|---|---|---|---|
| Electronics | 18 | 6 | +67% |
| Fashion Accessories | 12 | 9 | +25% |
| Home Gadgets | 22 | 10 | +55% |
| Toys | 5 | 14 | -64% |
Premium gifting has expanded beyond luxury into functional technology, with mid-range price bands ($40–$80) showing the highest demand growth. Consumers increasingly favor value-driven innovation over novelty. Subscription-based products and smart home accessories also gained traction, signaling longer product lifecycle relevance beyond the holiday season.
To build accurate gift rankings, Actowiz Metrics applied Web Scraping Christmas Gift Rankings and Insights across marketplaces to track performance indicators consistently.
| Metric | Weight |
|---|---|
| Sales Rank Stability | 30% |
| Price Competitiveness | 20% |
| Availability | 20% |
| Discount Activity | 15% |
| Consumer Ratings | 15% |
Products ranking in the Top 100 demonstrated strong stability even during high-traffic sale periods. Frequent rank volatility often correlated with supply constraints rather than demand drops. The analysis confirms that consistent availability and controlled discounting outperform aggressive price cuts in sustaining top gift rankings throughout the Christmas season.
Top Performers and Market Concentration Using Top 100 Christmas Gifts 2025 Insight Data Scraping, Actowiz Metrics identified increasing concentration among repeat-performing brands and SKUs.
| Year | Repeat Products in Top 100 |
|---|---|
| 2020 | 41 |
| 2022 | 53 |
| 2024 | 61 |
| 2025 | 68 |
| 2026* | 72 |
Brand familiarity, ecosystem compatibility, and positive reviews drive repeat success. Products that integrate with broader ecosystems—smartphones, wearables, home assistants—dominate rankings year after year. New entrants succeed primarily through differentiation or viral traction rather than price disruption alone.
With advanced E-commerce Analytics, Actowiz Metrics assessed how marketplace dynamics impact gift rankings.
| Platform Type | Avg Conversion Rate |
|---|---|
| Marketplaces | 4.6% |
| Brand Stores | 3.9% |
| Aggregators | 3.4% |
Marketplaces benefit from discovery-driven purchasing, especially during gifting seasons. Visibility algorithms, bundled promotions, and cross-category recommendations significantly influence rankings. Sellers optimizing listings for search relevance and seasonal keywords gain measurable ranking advantages during November–December traffic surges.
Applying Digital Shelf Analytics, Actowiz Metrics evaluated how pricing consistency and visibility influence Top 100 placement.
| Factor | Impact on Rank |
|---|---|
| Stock Availability | High |
| Price Stability | High |
| Discount Timing | Medium |
| Content Quality | Medium |
Products maintaining stable pricing and uninterrupted stock outperform heavily discounted items with inconsistent availability. Digital shelf control—images, descriptions, and reviews—plays a critical supporting role in sustaining ranking momentum during peak shopping windows.
Actowiz Metrics delivers deep, scalable insights that empower brands and retailers to outperform competitors during high-impact festive seasons using Price Benchmarking and large-scale product intelligence. Our advanced data infrastructure captures millions of product listings across global e-commerce platforms, enabling precise monitoring of pricing movements, ranking shifts, availability, and promotional behavior. By combining intelligent scraping frameworks with historical trend modeling and real-time analytics, we uncover the true drivers behind product success during Christmas gifting periods. From granular SKU-level performance tracking to category-wide demand forecasting, our solutions help businesses optimize assortments, refine pricing strategies, and time promotions for maximum impact. With fully compliant data pipelines, automated reporting, and customizable dashboards, Actowiz Metrics transforms raw product data into actionable insights. This allows decision-makers to respond faster to market changes, reduce uncertainty, and confidently plan holiday strategies that balance revenue growth with brand value protection.
Christmas gifting decisions are no longer driven by intuition alone—they are shaped by data, visibility, and competitive precision. Through structured analysis and Brand Competition Analysis, this research highlights how Top 100 gift rankings reveal deeper shifts in consumer preferences, pricing discipline, and digital shelf performance across marketplaces. Brands and retailers that leverage data-driven intelligence gain a measurable edge in forecasting demand, optimizing inventory allocation, and maximizing holiday revenue without eroding margins. As competition intensifies and consumer expectations evolve, timely and accurate insights become critical for success. Actowiz Metrics enables organizations to move from reactive planning to proactive strategy, ensuring they stay ahead of market trends during the most crucial sales period of the year.
Partner with Actowiz Metrics to transform Christmas gift data into strategic advantage, outperform competitors, and dominate the 2025 holiday season with confidence.
Expert blogs, research reports and infographics — practical, data-driven reading across e-commerce and quick-commerce.
Most fields are optional — the more you share, the better your sample.


.webp "infographics")
.webp "infographics")


