Create your own


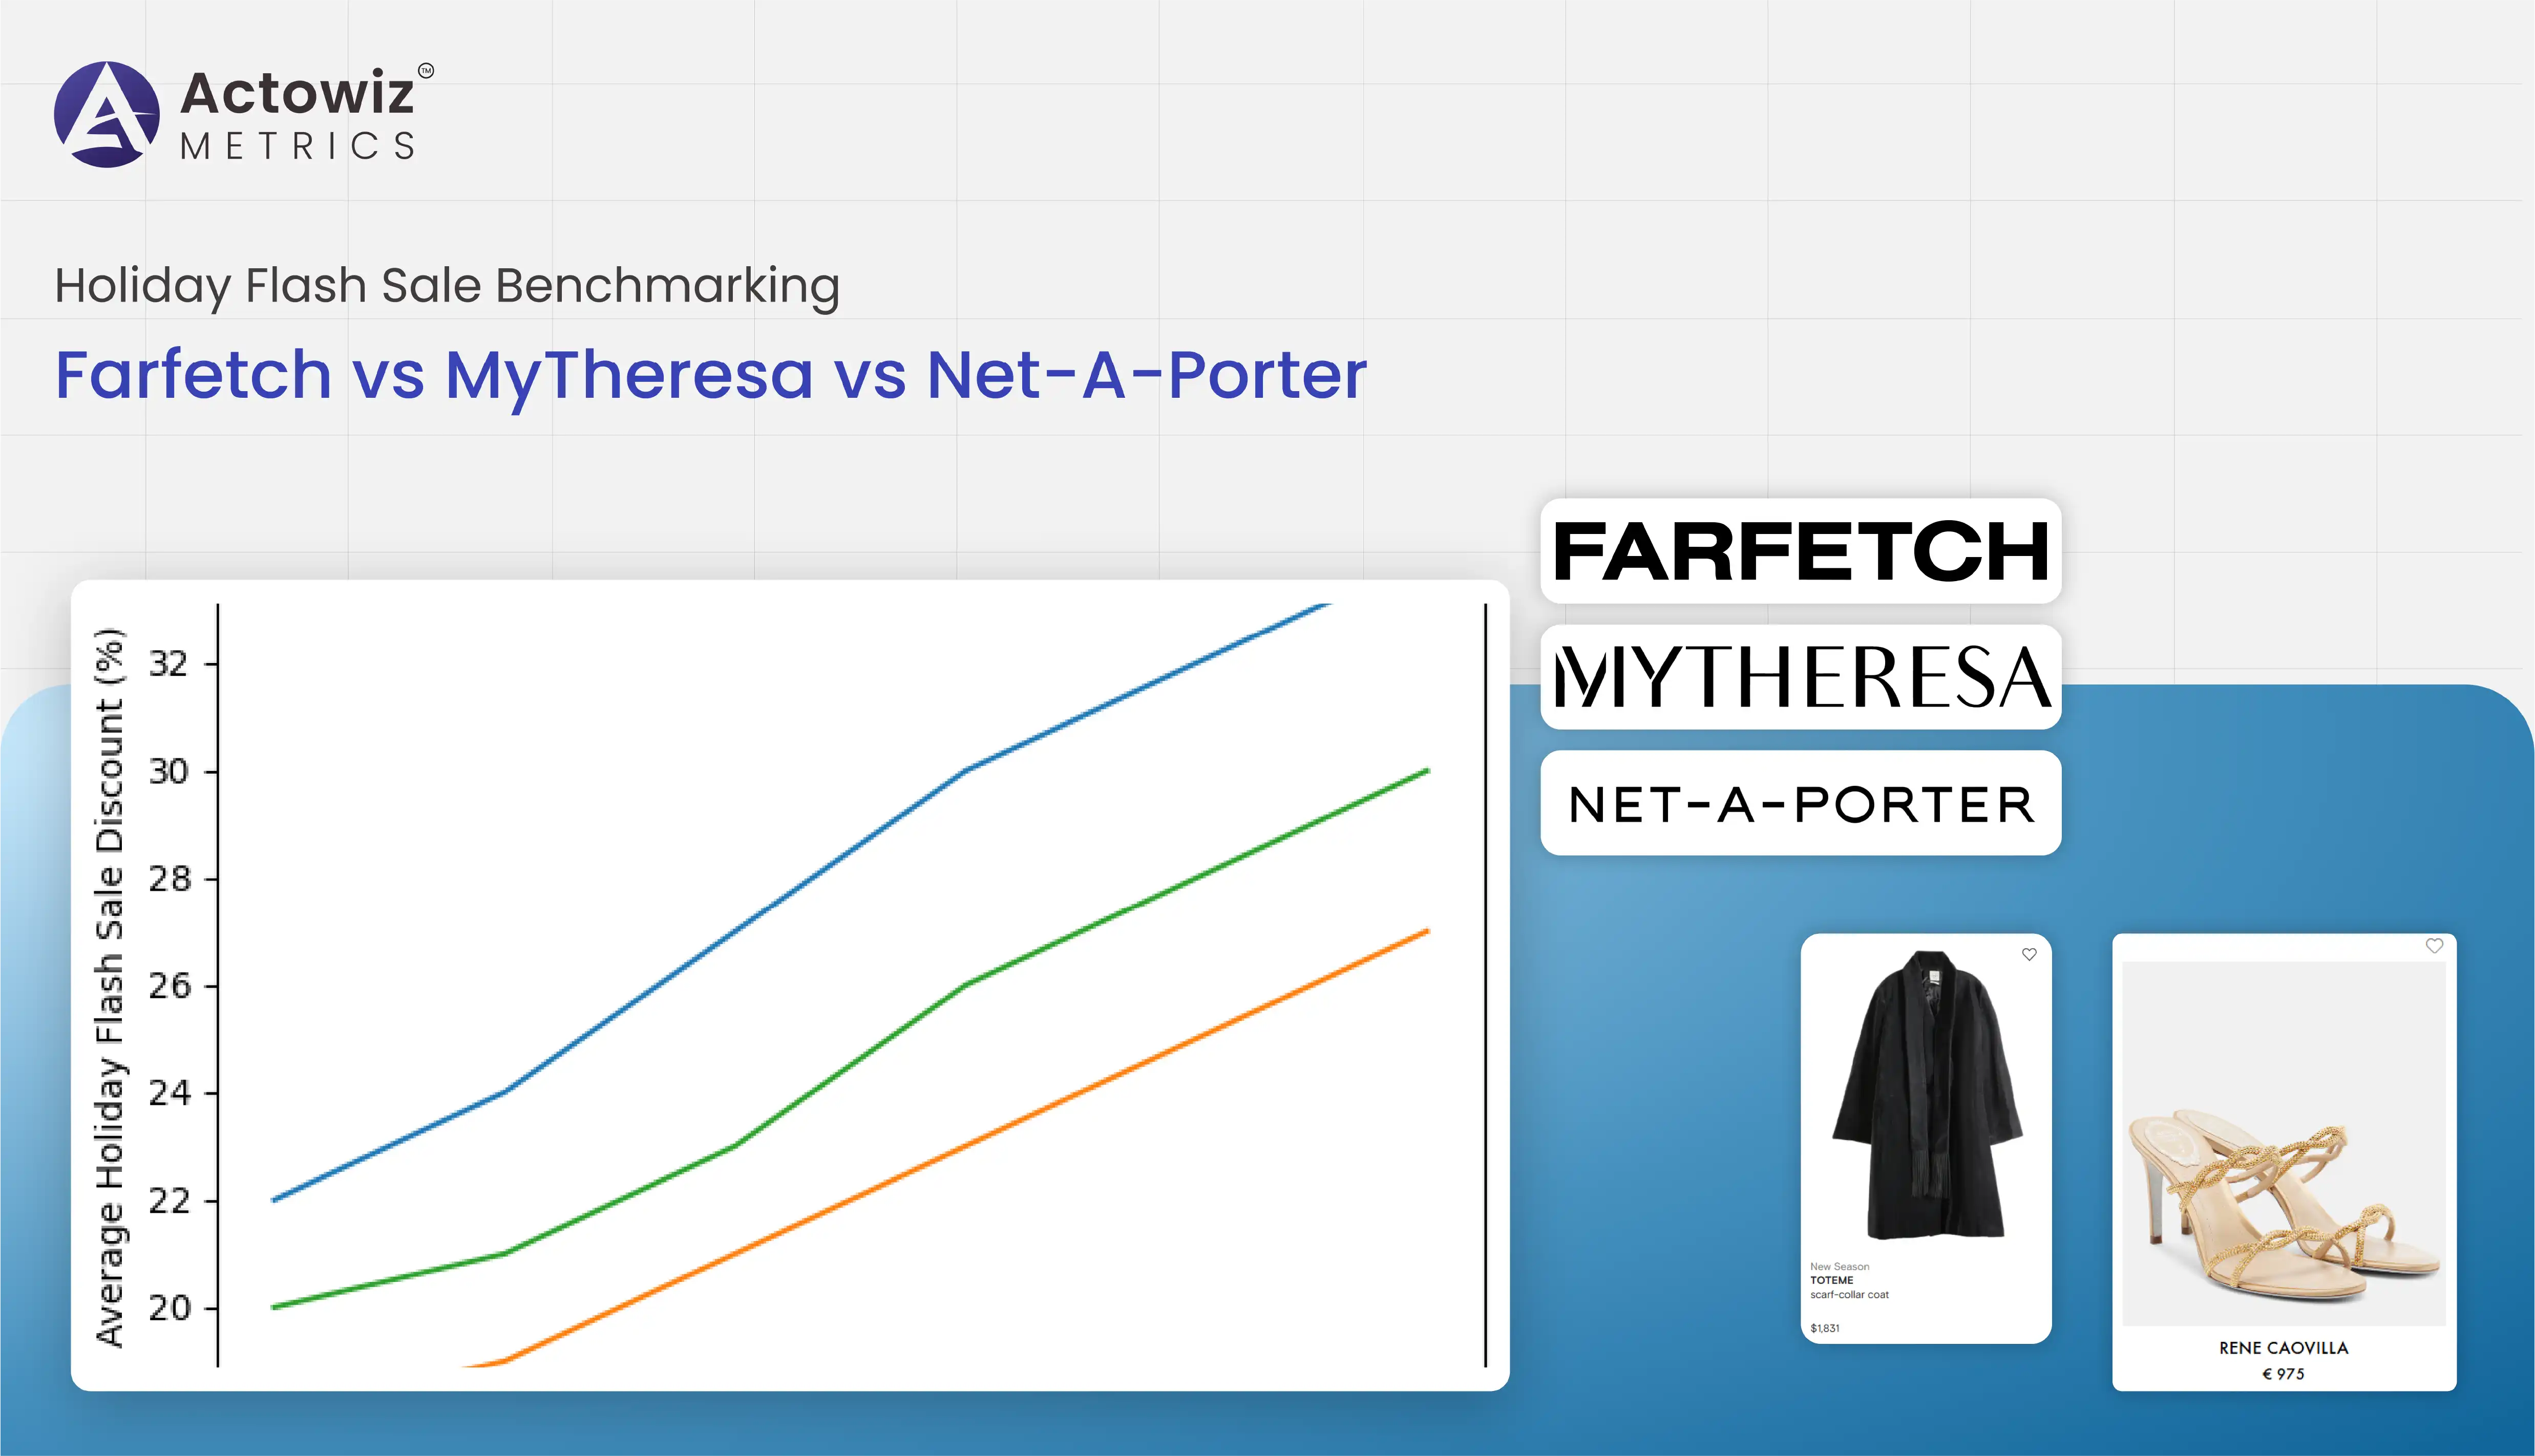
Luxury e-commerce flash sales have evolved into strategic revenue drivers rather than short-term clearance events. Seasonal discounting, especially during holiday periods, now influences brand perception, inventory velocity, and cross-platform competitiveness. This research report examines discount intensity, pricing volatility, and stock behavior across three leading luxury marketplaces using Holiday Flash Sale Benchmarking – Farfetch vs MyTheresa vs Net-A-Porter.
By applying structured Price Benchmarking, Actowiz Metrics evaluates how each platform balances exclusivity with aggressive promotions. The analysis spans six years of historical and projected data, highlighting discount cadence, SKU-level pricing shifts, and category-level competitive positioning. The findings empower brands, retailers, and analysts to understand how luxury flash sales are shaping consumer behavior, channel strategies, and margin optimization across global fashion marketplaces.
Using Scrape Holiday Flash Sale Data from Farfetch, Actowiz Metrics tracked discount behavior across apparel, footwear, handbags, and accessories. Combined with Brand Competition Analysis, this dataset reveals how Farfetch positions itself as a hybrid marketplace—balancing brand-controlled pricing with selective discount depth.
| Year | Avg Discount % | Sale SKUs | Stock Turnover |
|---|---|---|---|
| 2020 | 28% | 18,500 | 3.1x |
| 2022 | 32% | 24,100 | 3.8x |
| 2024 | 35% | 29,400 | 4.2x |
| 2026* | 37% | 33,000 | 4.6x |
Farfetch consistently increases SKU participation while maintaining moderate discount levels compared to competitors. This strategy protects brand equity while driving higher sell-through during holiday windows. The data shows that premium categories such as handbags maintain lower discount elasticity, while apparel drives volume-led discounting. Farfetch’s controlled approach positions it as a pricing reference point during peak sale periods.
Insights from the Holiday Flash Sale Data Scraper from MyTheresa highlight a contrasting strategy focused on exclusivity and tightly managed discounting. MyTheresa’s flash sales emphasize curated selections rather than mass SKU participation.
| Year | Avg Discount % | Sale SKUs | Full-Price Retention |
|---|---|---|---|
| 2020 | 24% | 9,800 | 71% |
| 2022 | 27% | 12,600 | 68% |
| 2024 | 29% | 15,400 | 65% |
| 2026* | 30% | 17,200 | 63% |
The platform’s restrained approach preserves brand desirability while offering targeted incentives to high-value customers. Unlike broader marketplaces, MyTheresa uses flash sales as loyalty levers rather than demand generators. The data indicates strong full-price retention even during peak holiday campaigns, making MyTheresa a benchmark for premium pricing discipline.
By leveraging Web Scraping Holiday Flash Sale Data from Net-A-Porter, alongside Product Data Tracking, Actowiz Metrics identified faster stock churn and deeper markdown cycles compared to competitors.
| Year | Avg Discount % | Sale SKUs | Avg Sell-Out Time |
|---|---|---|---|
| 2020 | 30% | 16,300 | 9.2 days |
| 2022 | 34% | 21,700 | 7.6 days |
| 2024 | 38% | 27,900 | 6.4 days |
| 2026* | 40% | 31,500 | 5.8 days |
Net-A-Porter prioritizes inventory liquidation efficiency, particularly for seasonal apparel. The platform’s flash sales show rapid discount escalation once sales begin, creating urgency-driven demand. This aggressive pricing model results in shorter product lifecycles but higher clearance efficiency, making it attractive for brands seeking faster inventory turnover.
Through Farfetch vs MyTheresa vs Net-A-Porter Sale Data Analytics, Actowiz Metrics compared platform behavior across pricing depth, SKU scale, and discount velocity.
| Platform | Avg Discount (2024) | Sale SKU Scale | Discount Volatility |
|---|---|---|---|
| Farfetch | 35% | High | Medium |
| MyTheresa | 29% | Low | Low |
| Net-A-Porter | 38% | Medium | High |
The analysis shows clear segmentation. Farfetch balances scale and control, MyTheresa protects exclusivity, and Net-A-Porter optimizes speed and clearance. Brands participating across all three platforms must adopt differentiated pricing and inventory strategies to avoid internal cannibalization while maximizing seasonal exposure.
Using Extract Holiday Flash Sale Data - Farfetch vs MyTheresa vs Net-A-Porter, Actowiz Metrics identified increasing synchronization in sale timing across platforms.
| Year | Overlapping Sale Days | Avg Price Gap |
|---|---|---|
| 2020 | 42% | 11% |
| 2022 | 55% | 9% |
| 2024 | 63% | 7% |
| 2026* | 70% | 5% |
As sale calendars align, price gaps narrow, intensifying competition. This convergence increases the importance of real-time monitoring to avoid undercutting or MAP violations. Brands benefit from understanding which platform leads price drops and which follows, enabling proactive pricing governance.
By analyzing Extract Flash Sale Pricing Trends from Luxury Marketplaces, Actowiz Metrics projects continued growth in flash-sale participation through 2026.
| Year | Avg Discount | Consumer Sale Dependency |
|---|---|---|
| 2020 | 27% | 48% |
| 2023 | 34% | 56% |
| 2024 | 37% | 61% |
| 2026* | 41% | 68% |
Luxury consumers increasingly wait for holiday flash sales, reshaping full-price demand curves. Platforms that manage discount cadence intelligently will sustain margins while retaining loyalty. Brands that fail to benchmark competitors risk margin erosion and brand dilution during peak sales cycles.
Actowiz Metrics enables brands, retailers, and analysts to transform fragmented flash-sale data into actionable intelligence through advanced E-commerce Analytics. Our solutions are designed to monitor large-scale luxury marketplaces with high accuracy, capturing pricing shifts, discount depth, stock availability, and competitive movements in real time. We combine automated data extraction, historical benchmarking, and predictive modeling to help businesses understand how holiday sales impact brand positioning and revenue performance. Actowiz Metrics delivers clean, structured datasets through APIs and interactive dashboards, ensuring insights are accessible across pricing, merchandising, and strategy teams. With a strong focus on data compliance, scalability, and customization, we support decision-makers in responding faster to market changes, optimizing promotional strategies, and protecting margins during high-pressure holiday flash sale periods.
Holiday flash sales have become critical moments that shape consumer perception and competitive standing in luxury e-commerce. By leveraging Digital Shelf Analytics, brands gain clear visibility into discount patterns, pricing alignment, and inventory movement across Farfetch, MyTheresa, and Net-A-Porter. This research report demonstrates how structured benchmarking empowers businesses to anticipate competitor moves, manage pricing consistency, and optimize sale participation without eroding brand equity. With real-time insights and historical trend analysis, decision-makers can replace reactive pricing with proactive, data-driven strategies. Actowiz Metrics equips organizations with the intelligence required to navigate complex holiday promotions confidently and profitably.
Partner with Actowiz Metrics to turn holiday flash sale data into strategic advantage, protect brand value, and outperform competitors during the most critical sales periods.

Whatever your project size is, we will handle it well with all the standards fulfilled! We are here to give 100% satisfaction.
Any analytics feature you need — we provide it
24/7 global support
Real-time analytics dashboard
Full data transparency at every stage
Customized solutions to achieve your data analysis goals