
Online Competitor Price Monitoring Software
Online Competitor Price Monitoring Software helps businesses track competitor pricing in real time, optimize strategies, and improve profit margins using data-driven insights.


The global footwear industry has witnessed rapid transformation over the past few years, driven by evolving fashion preferences, digital retail expansion, and increased consumer awareness. This report, Men’s Footwear Trends Data Analysis, provides a comprehensive overview of pricing strategies, demand patterns, and competitive dynamics shaping the global market through 2026. With the growing importance of online retail, businesses are increasingly relying on E-commerce Analytics to monitor performance, optimize pricing, and enhance customer engagement.
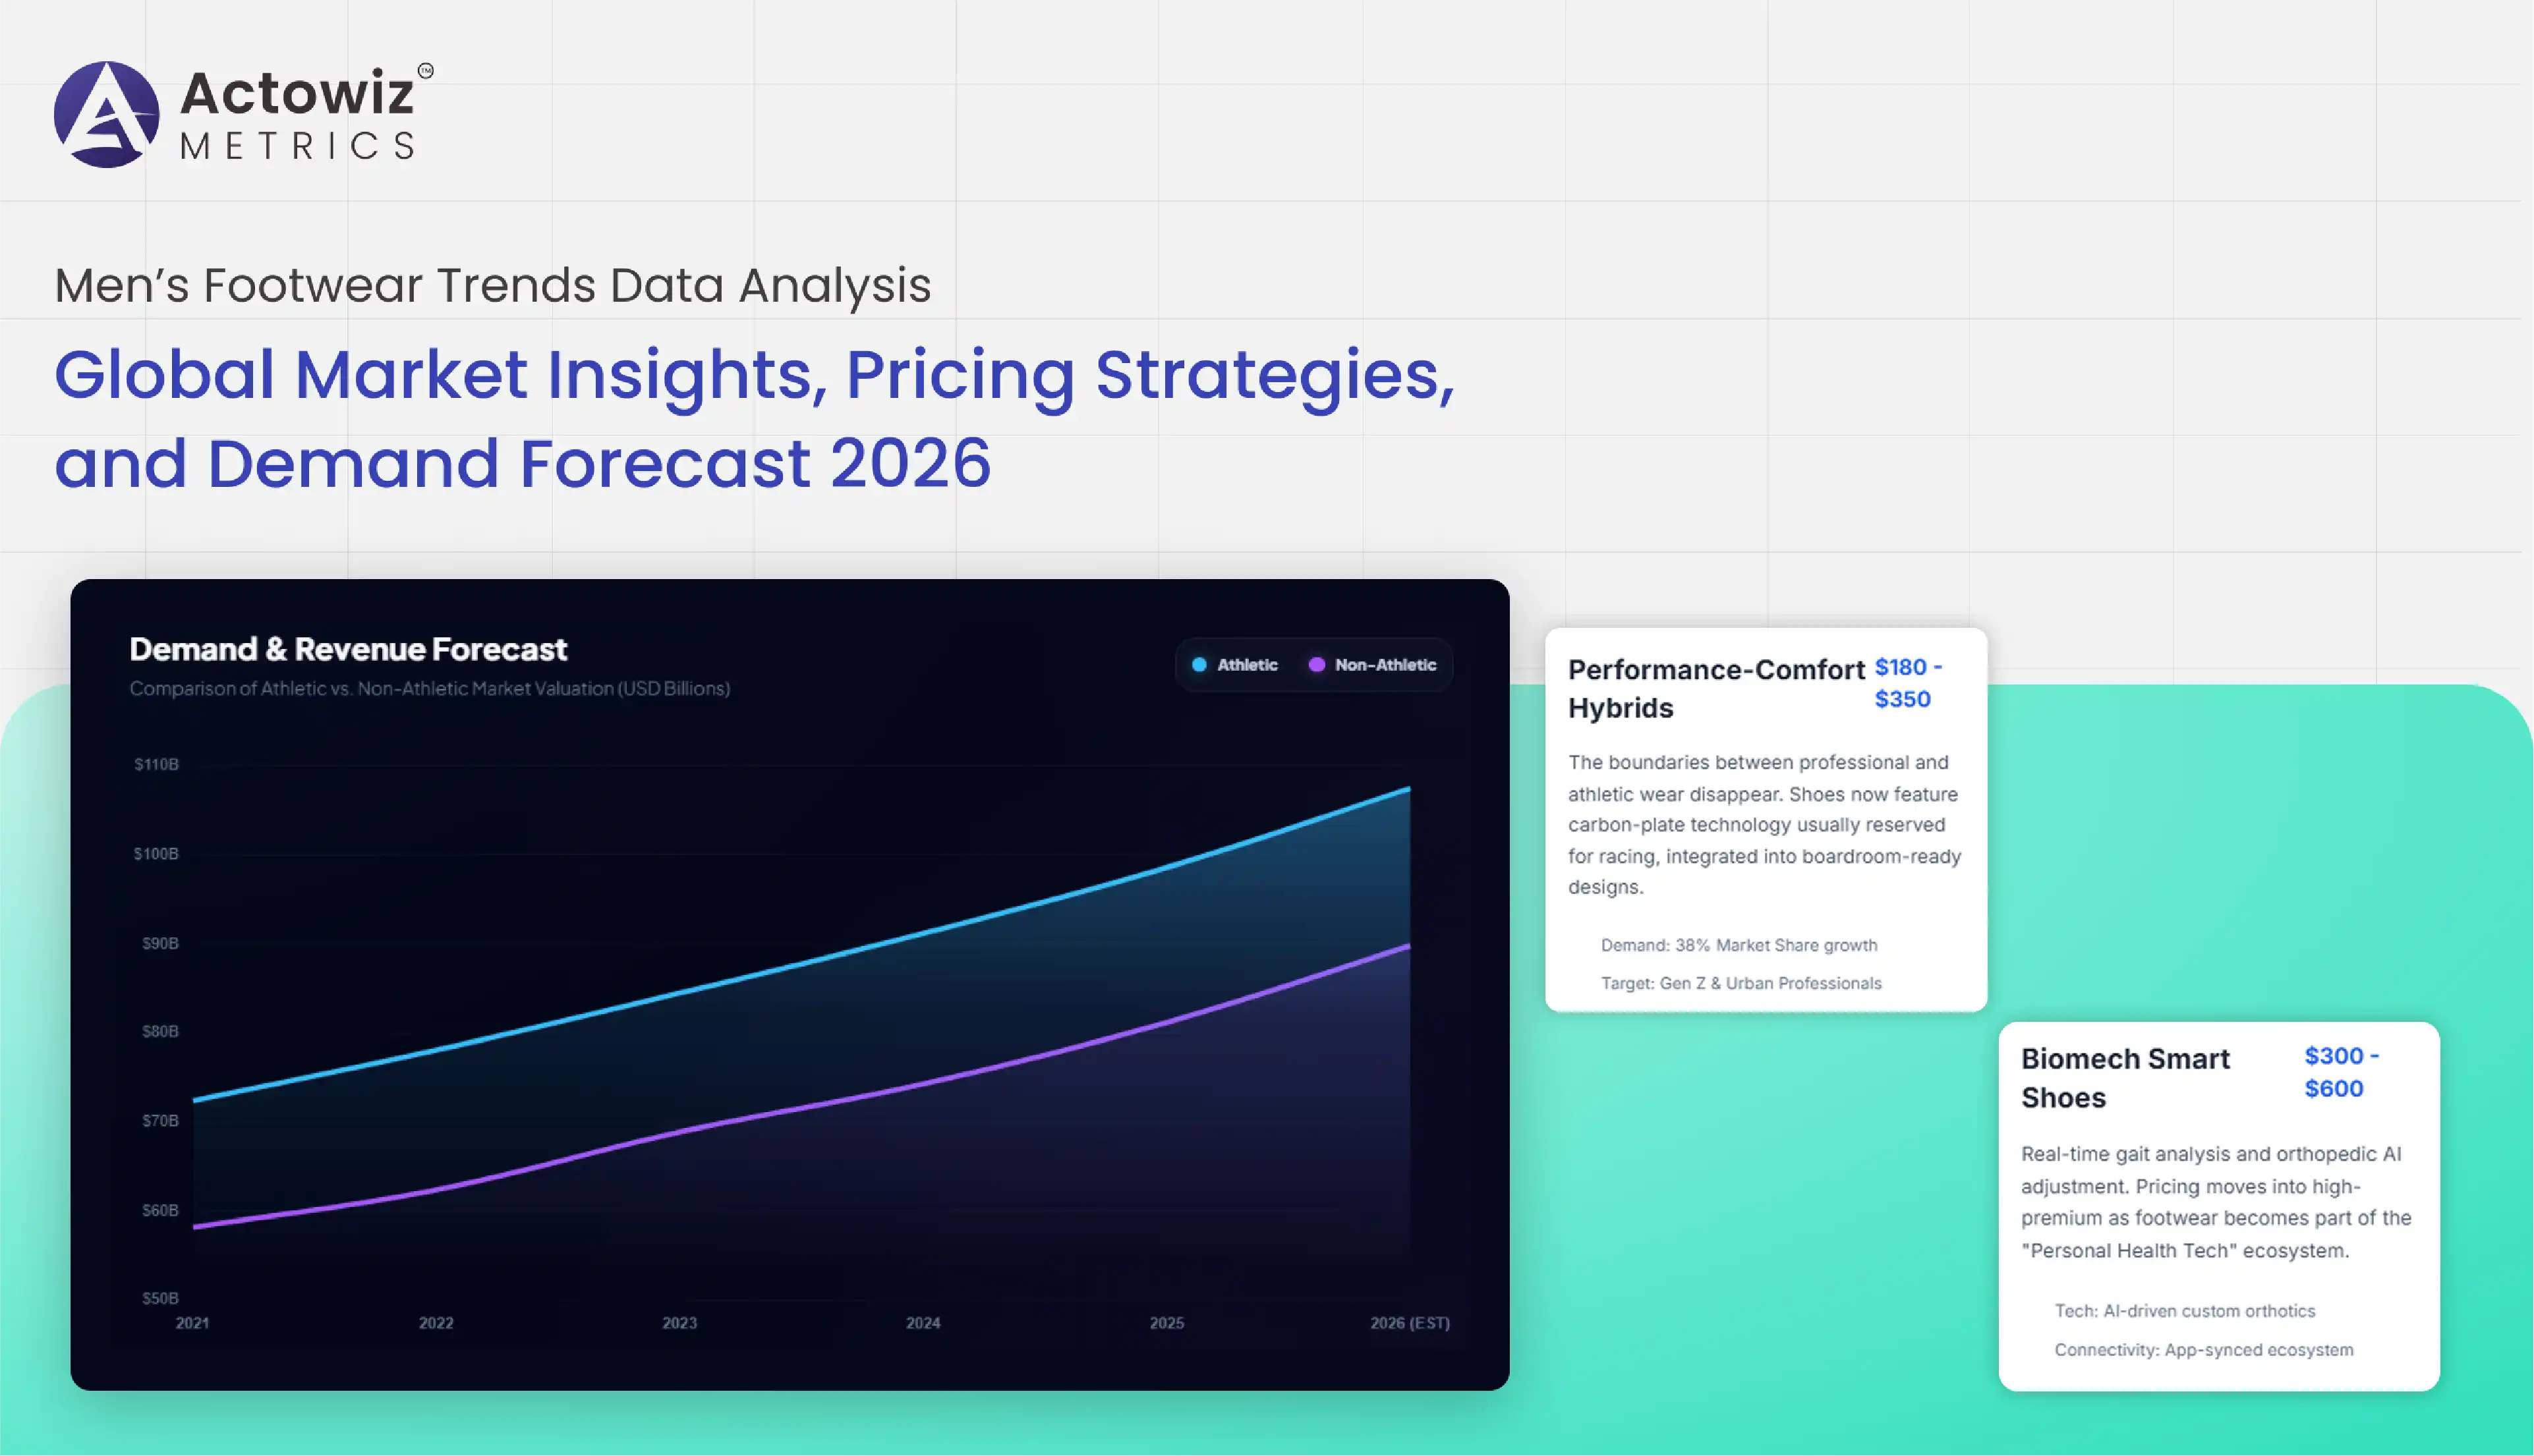
Between 2020 and 2026, the men’s footwear segment has experienced steady growth, supported by rising disposable incomes, increased focus on athleisure, and growing adoption of branded footwear. Sneakers, casual shoes, and performance footwear have emerged as key categories driving demand. At the same time, pricing fluctuations, promotional strategies, and regional variations have created a need for advanced data intelligence solutions.
This report explores critical aspects such as pricing trends, stock availability, consumer behavior, and digital shelf performance across major regions including North America, Europe, and Asia-Pacific. By leveraging structured datasets and advanced analytics, businesses can gain actionable insights to optimize product strategies, improve market positioning, and drive sustainable growth in a competitive landscape.
The men’s footwear market has demonstrated consistent growth, driven by innovation, brand competition, and increased online penetration. By leveraging Scrape Men’s Footwear Trends Data, Product Data Tracking, businesses can monitor SKU-level performance across multiple platforms and gain a deeper understanding of consumer demand patterns.
From 2020 to 2026, the global men’s footwear market has grown at a CAGR of approximately 6.2%, with online sales contributing significantly to this expansion. Sneakers account for nearly 45% of total sales, followed by casual shoes at 30% and formal footwear at 25%.
| Year | Market Size ($Bn) | E-commerce Share (%) | Avg Price ($) | Growth Rate (%) |
|---|---|---|---|---|
| 2020 | 85 | 22 | 65 | 4.8 |
| 2022 | 95 | 28 | 70 | 5.5 |
| 2024 | 108 | 34 | 75 | 6.0 |
| 2026 | 122 | 38 | 82 | 6.2 |
Product data tracking enables brands to identify high-performing SKUs, monitor seasonal demand spikes, and optimize product assortments. With real-time insights, businesses can adjust strategies quickly to align with changing consumer preferences and market trends.
Understanding regional variations is essential for effective market expansion and strategy development. Through Men’s Footwear Trends Data Monitoring, Map Monitoring, businesses can analyze geographic demand patterns and optimize distribution networks.
North America remains the largest market, driven by strong brand presence and high consumer spending. Europe follows with a focus on premium and sustainable footwear, while Asia-Pacific shows the fastest growth due to urbanization and rising middle-class income.
| Region | Market Share (%) | Avg Price ($) | Growth Rate (%) | Key Drivers |
|---|---|---|---|---|
| North America | 34 | 90 | 5.8 | Brand demand, athleisure |
| Europe | 27 | 85 | 5.5 | Sustainability |
| Asia-Pacific | 29 | 65 | 7.2 | Urbanization |
| Rest of World | 10 | 60 | 4.9 | Emerging markets |
Geographic mapping helps businesses identify high-demand regions, optimize inventory allocation, and improve delivery efficiency. It also enables targeted marketing strategies to capture regional consumer preferences effectively.
Accurate data extraction is critical for gaining competitive insights and maintaining market visibility. By utilizing Men’s Footwear Trends Data Scraping, companies can collect structured data on pricing, product listings, and customer engagement across multiple platforms.
From 2020 to 2026, the volume of online product listings has increased significantly, with major e-commerce platforms expanding their footwear categories. The number of SKUs available online has grown by over 40%, reflecting increased competition and product diversity.
| Metric | 2020 | 2023 | 2026 |
|---|---|---|---|
| SKU Count (Millions) | 1.2 | 1.6 | 1.8 |
| Avg Listings per Brand | 500 | 750 | 900 |
| Platform Coverage (%) | 65 | 75 | 85 |
Data scraping enables businesses to monitor competitor activities, identify pricing gaps, and track product performance. This information is crucial for maintaining visibility and ensuring that products remain competitive in a crowded marketplace.
Pricing plays a pivotal role in influencing consumer purchasing decisions. Through Men’s Footwear Price Tracking & Discount Analysis, businesses can monitor pricing fluctuations and evaluate the effectiveness of promotional strategies.
Between 2020 and 2026, average footwear prices have increased due to rising production costs and premiumization trends. However, discounts and promotional campaigns continue to drive significant sales volumes, particularly during seasonal events.
| Category | Avg Price ($) | Discount Range (%) | Conversion Rate (%) |
|---|---|---|---|
| Sneakers | 90 | 15–30 | 35 |
| Casual Shoes | 70 | 10–25 | 28 |
| Formal Shoes | 95 | 5–20 | 22 |
Pricing intelligence allows businesses to optimize discount strategies, improve margins, and enhance customer acquisition. Real-time price tracking ensures that brands remain competitive and responsive to market changes.
Efficient inventory management is essential for maintaining customer satisfaction and maximizing sales. By leveraging Men’s Footwear Inventory & Stock Availability Insights, businesses can monitor stock levels and reduce the risk of stockouts or overstocking.
From 2020 to 2026, stock availability has improved significantly due to better supply chain management and data-driven forecasting. However, high-demand products still experience occasional shortages during peak seasons.
| Metric | 2020 | 2023 | 2026 |
|---|---|---|---|
| Stock Availability (%) | 82 | 88 | 93 |
| Stockout Frequency (%) | 18 | 12 | 7 |
| Inventory Turnover Ratio | 3.5 | 4.2 | 4.8 |
Inventory insights help businesses optimize supply chains, reduce operational costs, and improve customer experience. By aligning inventory levels with demand patterns, companies can achieve better efficiency and profitability.
The digital shelf has become a critical factor in driving online sales and brand visibility. Through Digital Shelf Analytics, businesses can optimize product listings, improve search rankings, and enhance customer engagement.
Between 2020 and 2026, the importance of digital shelf performance has increased significantly, with over 75% of consumers researching products online before making a purchase. Factors such as product images, descriptions, and reviews play a crucial role in influencing buying decisions.
| Metric | Impact on Sales (%) |
|---|---|
| Product Images | 28 |
| Customer Reviews | 32 |
| Pricing Visibility | 20 |
| SEO Optimization | 20 |
Optimizing the digital shelf ensures better product discoverability and higher conversion rates. Businesses that invest in digital shelf strategies are better positioned to capture market share and drive growth in the competitive e-commerce landscape.
Actowiz Metrics offers advanced data intelligence solutions designed to help businesses stay ahead in competitive markets. With expertise in Price Benchmarking and Men’s Footwear Trends Data Analysis, Actowiz provides comprehensive insights into pricing strategies, competitor activities, and consumer behavior.
Their solutions include real-time data tracking, customizable dashboards, and scalable analytics platforms, enabling businesses to make informed decisions quickly. By leveraging cutting-edge technology and industry expertise, Actowiz Metrics ensures accurate, reliable, and actionable insights for sustainable growth.
The men’s footwear market is evolving rapidly, driven by changing consumer preferences, technological advancements, and increasing competition. Through Brand Competition Analysis and Men’s Footwear Trends Data Analysis, businesses can gain a holistic understanding of market dynamics and develop effective strategies.
From pricing optimization to inventory management and digital shelf performance, data-driven decision-making is essential for success in today’s competitive landscape. Companies that leverage advanced analytics and real-time insights will be better equipped to adapt to market changes and achieve long-term growth.
Unlock the power of data with Actowiz Metrics enhance your market strategy, optimize pricing, and stay ahead of the competition today!

Track beauty product pricing, rankings, and promotions with Shopee Beauty Brands Product Data Extraction for smarter retail insights.
Explore Now
Improve shelf visibility and pricing strategies with Scrape Cookie Brand Products Data on Publix for real-time retail intelligence.
Explore Now
Track private label performance, pricing, and shelf share trends with H-E-B Grocery Private Label Market Share Data Analytics insights.
Explore Now


Browse expert blogs, case studies, reports, and infographics for quick, data-driven insights across industries.
Online Competitor Price Monitoring Software helps businesses track competitor pricing in real time, optimize strategies, and improve profit margins using data-driven insights.

Track leading cosmetics, skincare, fragrance, and wellness brands using Beauty Brand Market Share Analytics UK for pricing, demand trends, and competitive insights.

Ratings and Review Analytics for Fashion Brand helps brands analyze customer feedback, improve products, reduce returns, and boost ecommerce conversions.

Nike vs Hoka Amazon Footwear Products Data Analytics compares reviews, pricing, sentiment, and sales trends to reveal performance gaps and growth insights.

Smartphone Sales Product Data Analytics on Amazon and Walmart helps brands optimize pricing, visibility, inventory, and conversions.

Amazon Basics Bestsellers Products Data Analytics reveals pricing trends, ratings impact, and marketplace visibility across Amazon’s top-performing SKUs.
.webp "infographics")
Apparel & lifestyle brand performance analytics comparing Shein vs Zara across revenue growth, digital engagement, pricing strategy, and market reach trend

Quick Commerce Discount Strategy & Basket Analysis - Blinkit vs Zepto reveals pricing tactics, basket trends, and insights to optimize growth.

The Warehouse vs Briscoes vs Farmers – Cross-Category Product Mapping compares pricing, assortment, and category overlaps to uncover competitive insights and retail trends.

Best Ring products Analytics on Amazon Saudi Arabia delivers insights into pricing, rankings, reviews, inventory trends, and competitor performance tracking.

Best Huggies products Tracking on Amazon Saudi Arabia helps monitor pricing, ratings, reviews, rankings, and bestseller trends for data-driven product analysis and market insights.

Large Appliances Bestsellers Products Analytics on Amazon to track trends, pricing insights, and top-performing products for smarter retail decisions.
Whatever your project size is, we will handle it well with all the standards fulfilled! We are here to give 100% satisfaction.
Any analytics feature you need — we provide it
24/7 global support
Real-time analytics dashboard
Full data transparency at every stage
Customized solutions to achieve your data analysis goals