BLOG


Every August, two major events converge on the Indian retail calendar: Raksha Bandhan and Independence Day. In 2025, Raksha Bandhan fell on August 9 (Saturday), just days before Independence Day (August 15)—creating a 10-day high-volume sales window across Q-commerce, e-commerce, and D2C platforms.
This period saw price drops, flash deals, bundled offers, and dynamic repricing—all competing for consumer attention.
To decode what really happened behind the scenes, Actowiz Metrics deployed advanced scraping tools and analytics models to scrape Independence Day offers & product prices, and conduct a deep Independence Day & Raksha Bandhan Sale Price Analysis.
This blog analyzes:
This blog analyzes:
Actowiz Metrics collected real-time sale data from the following platforms using automated scrapers:
| Platform | Type | Coverage | Data Frequency |
|---|---|---|---|
| Amazon India | E-commerce | Nationwide | Hourly |
| Flipkart | E-commerce | Nationwide | Hourly |
| Blinkit | Quick Commerce | Metro & Tier 2 | Every 3 hrs |
| Zepto | Quick Commerce | PAN India | Every 3 hrs |
| Myntra | Fashion E-com | Nationwide | Twice Daily |
| Croma | Electronics Retail | PAN India | Hourly |
Actowiz Metrics used a multi-layered scraper architecture to monitor:
The scraped data was processed via our Independence Day Sale Price Data Analytics Dashboard and Raksha Bandhan Sale Price Comparison Engine.
| Date | MRP (₹) | Sale Price (₹) | Price Drop % | Label |
|---|---|---|---|---|
| Aug 5 | ₹899 | ₹749 | 16.6% | Raksha Bandhan Special |
| Aug 8 | ₹899 | ₹699 | 22.2% | Rakhi Weekend Flash Sale |
| Aug 10 | ₹899 | ₹749 | 16.6% | Normal Offer Resumed |
Insight: Peak discount was on August 8 (Friday) before Raksha Bandhan.
| Date | MRP (₹) | Sale Price (₹) | Drop % | Sale Type |
|---|---|---|---|---|
| Aug 13 | ₹2,999 | ₹1,999 | 33.3% | Independence Day Early Deal |
| Aug 15 | ₹2,999 | ₹2,499 | 16.7% | Regular Deal |
| Aug 16 | ₹2,999 | ₹2,699 | 10.0% | Post-Sale Rebound |
Insight: The lowest price was NOT on the 15th, but two days before.
| Category | Avg. Price Drop % | Top Performing Platform |
|---|---|---|
| Electronics | 23.6% | Amazon, Croma |
| Fashion Apparel | 28.2% | Myntra, Flipkart |
| Gifting Combos | 18.9% | Blinkit, Flipkart |
| Home Appliances | 20.4% | Amazon, Croma |
| Grocery Basics | 12.7% | Zepto, Blinkit |
Insight: Fashion had the deepest discounts, especially for Raksha Bandhan.
Actowiz’s Independence Day Flash Sale Performance Data tool uncovered the following behavior:

| Platform | Individual Price (Total) | Bundle Price | Discount (%) |
|---|---|---|---|
| Amazon | ₹960 | ₹799 | 16.7% |
| Zepto | ₹940 | ₹749 | 20.2% |
| Flipkart | ₹985 | ₹729 | 26.0% |
Key Insight: Flipkart offered the best value on curated bundles.
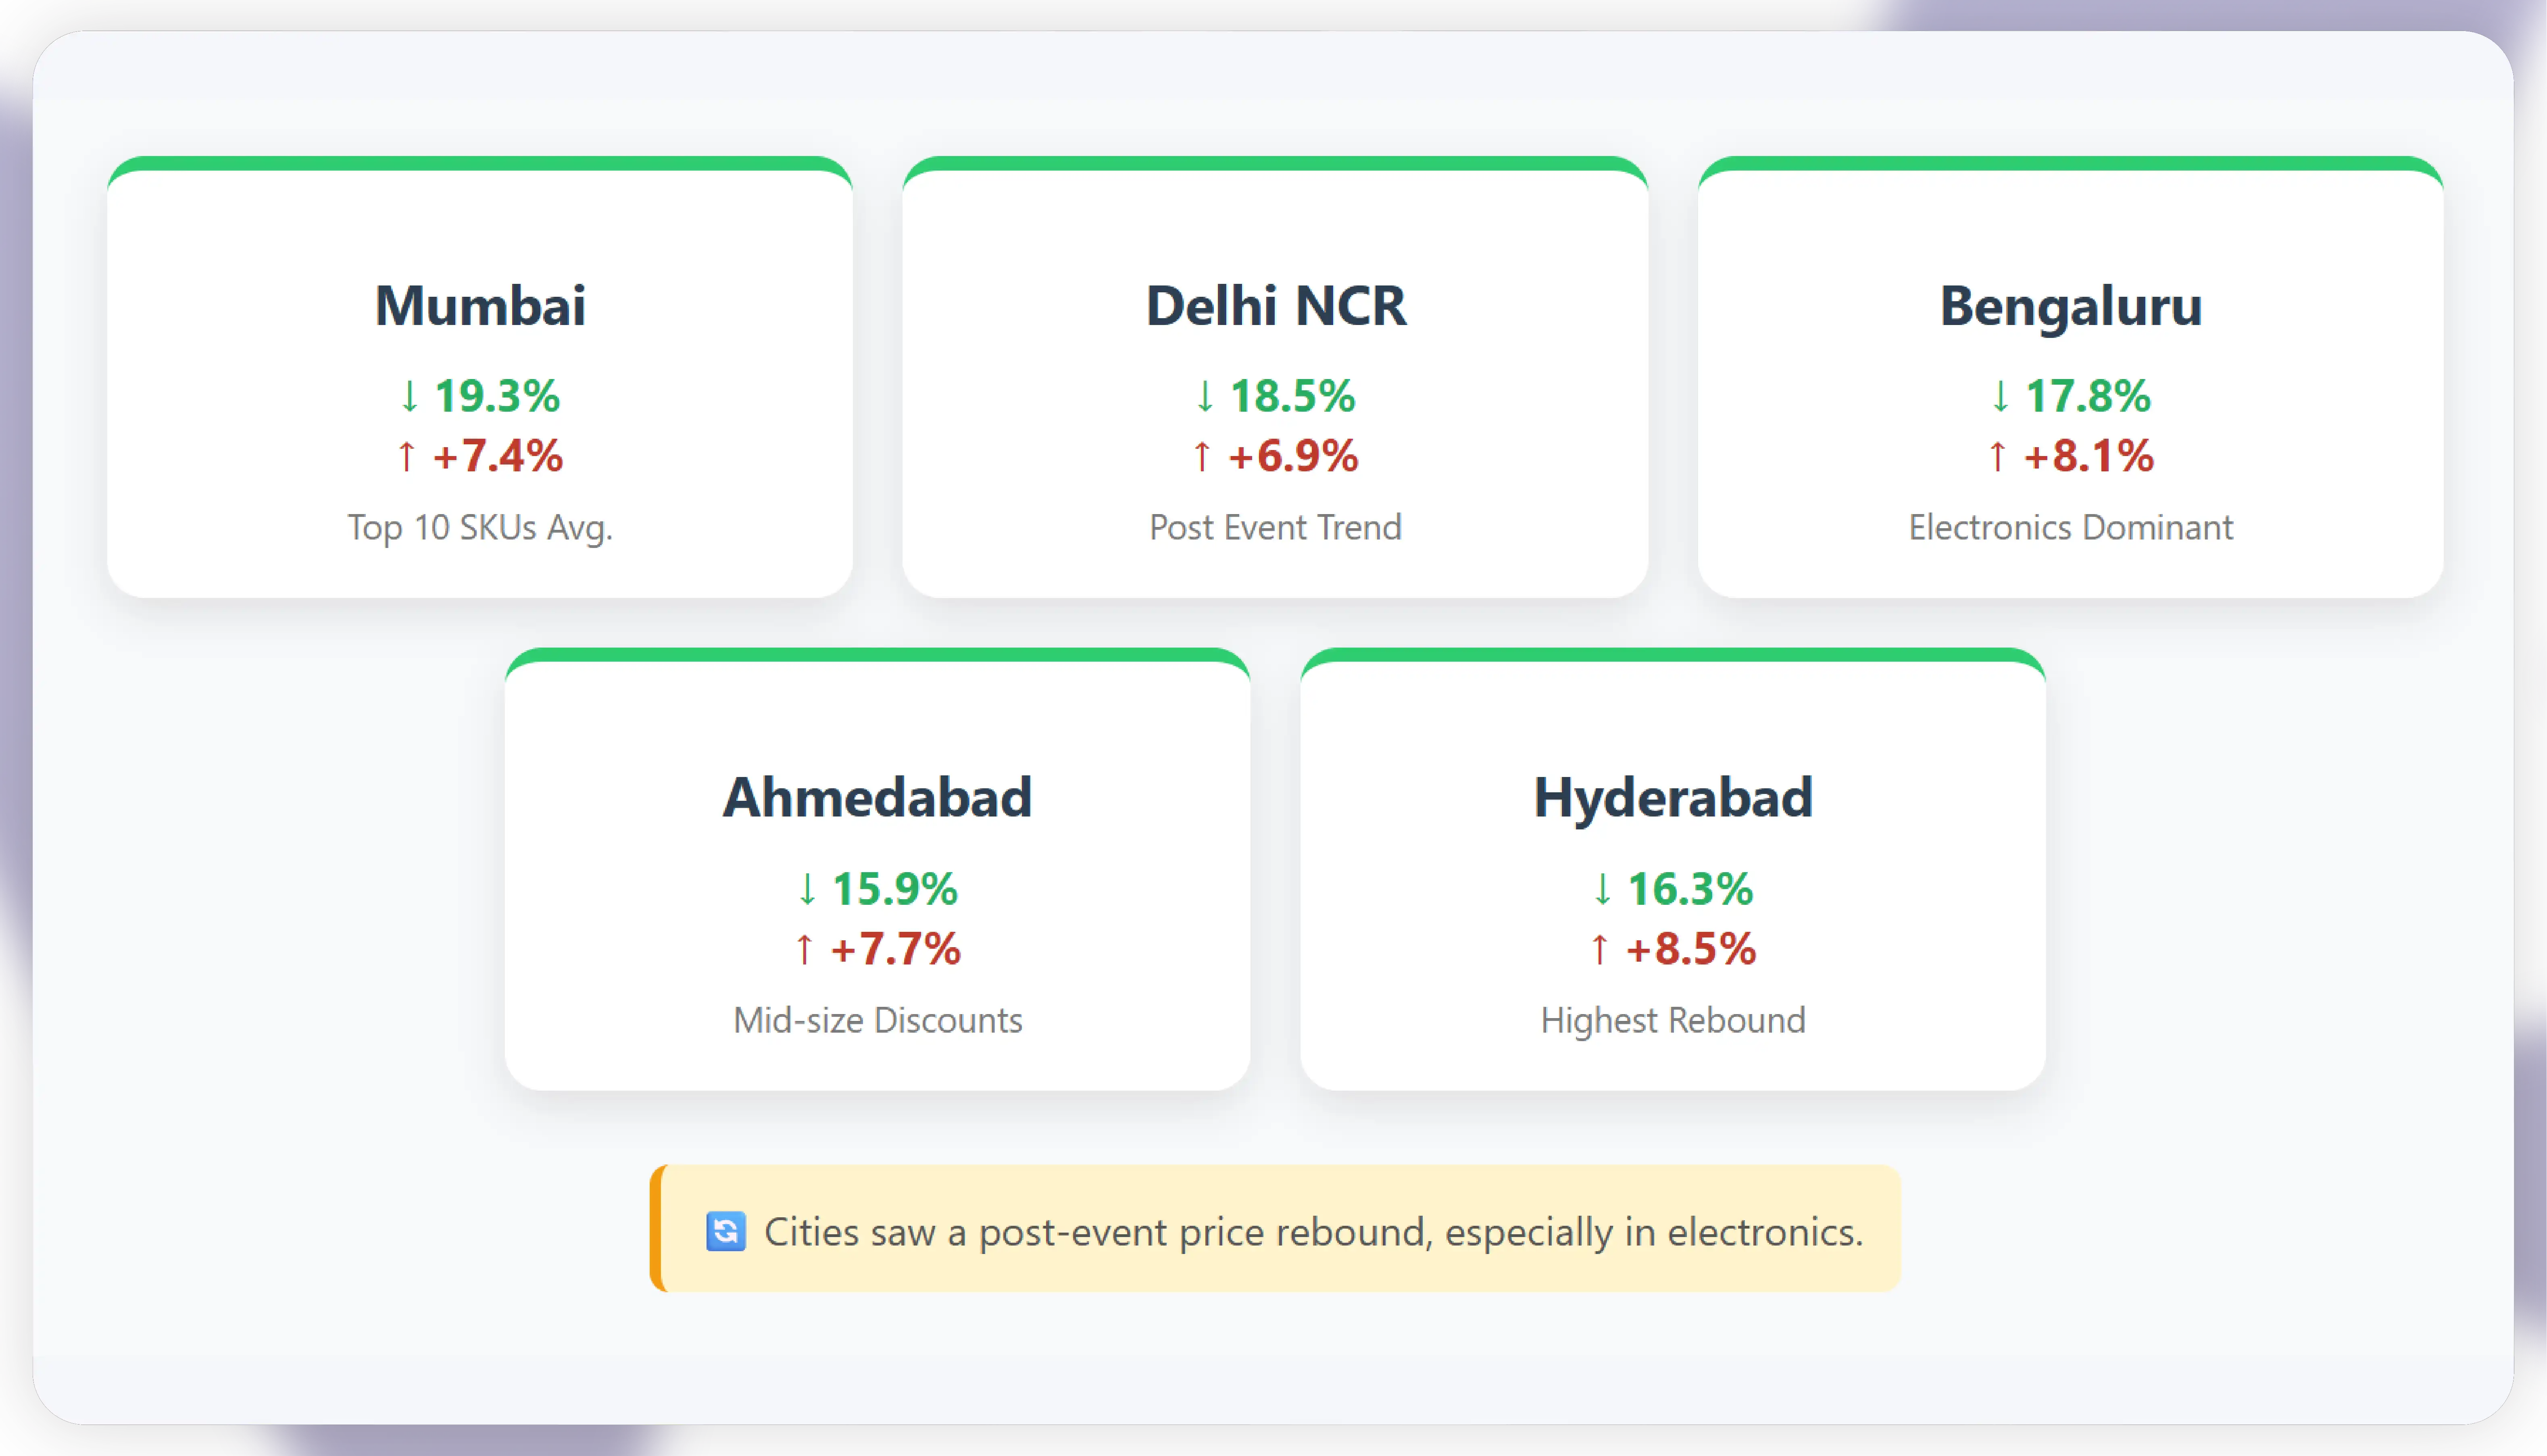
| City | Avg. % Drop (Top 10 SKUs) | Price Rebound (Aug 16) |
|---|---|---|
| Mumbai | 19.3% | +7.4% |
| Delhi NCR | 18.5% | +6.9% |
| Bengaluru | 17.8% | +8.1% |
| Ahmedabad | 15.9% | +7.7% |
| Hyderabad | 16.3% | +8.5% |
Cities saw a post-event price rebound, especially in electronics.
“We used Actowiz Metrics’ Independence Day sale price tracking tools to optimize our promotions across three platforms. By identifying flash sale dips in real-time, we launched counter-offers that led to a 23% lift in order volume during Raksha Bandhan weekend.”
— Growth Manager, National FMCG Brand
Integrated with Google Data Studio, Power BI, and Tableau
| Tool Name | Purpose |
|---|---|
| Real-Time Product Tracker | Tracks MRP, offer price, coupon impact |
| Flash Sale Detector | Detects time-boxed price dips |
| Price Rebound Estimator | Predicts post-sale price bounce |
| Bundle Analyzer (Raksha Bandhan Special) | Compares single vs combo prices |
| Independence Day Dashboard Suite | Platform/category/city-wise analytics |
| Action Item | Why It Matters |
|---|---|
| Monitor prices hourly | Flash sales are short and regionally targeted |
| Analyze bundles before designing | You may be underpricing or underdelivering |
| Start discounts early | Best response is 1–2 days before peak days |
| Use scraped data, not assumptions | Competitors are changing prices in real-time |
| Target cities separately | Metro pricing behavior varies greatly |
Based on Raksha Bandhan sale price comparison and Independence Day product price drop analysis, Actowiz Metrics predicts:
The festive price wars of August 2025 revealed the power of data over gut. With Independence Day & Raksha Bandhan Sale Price Analysis creating a price volatility spike, brands using Actowiz Metrics gained a strategic edge through:
Data-driven promotions are the future and Actowiz Metrics helps you how to stay ahead!

Expert blogs, research reports and infographics — practical, data-driven reading across e-commerce and quick-commerce.
Most fields are optional — the more you share, the better your sample.


.webp "infographics")
.webp "infographics")


