BLOG


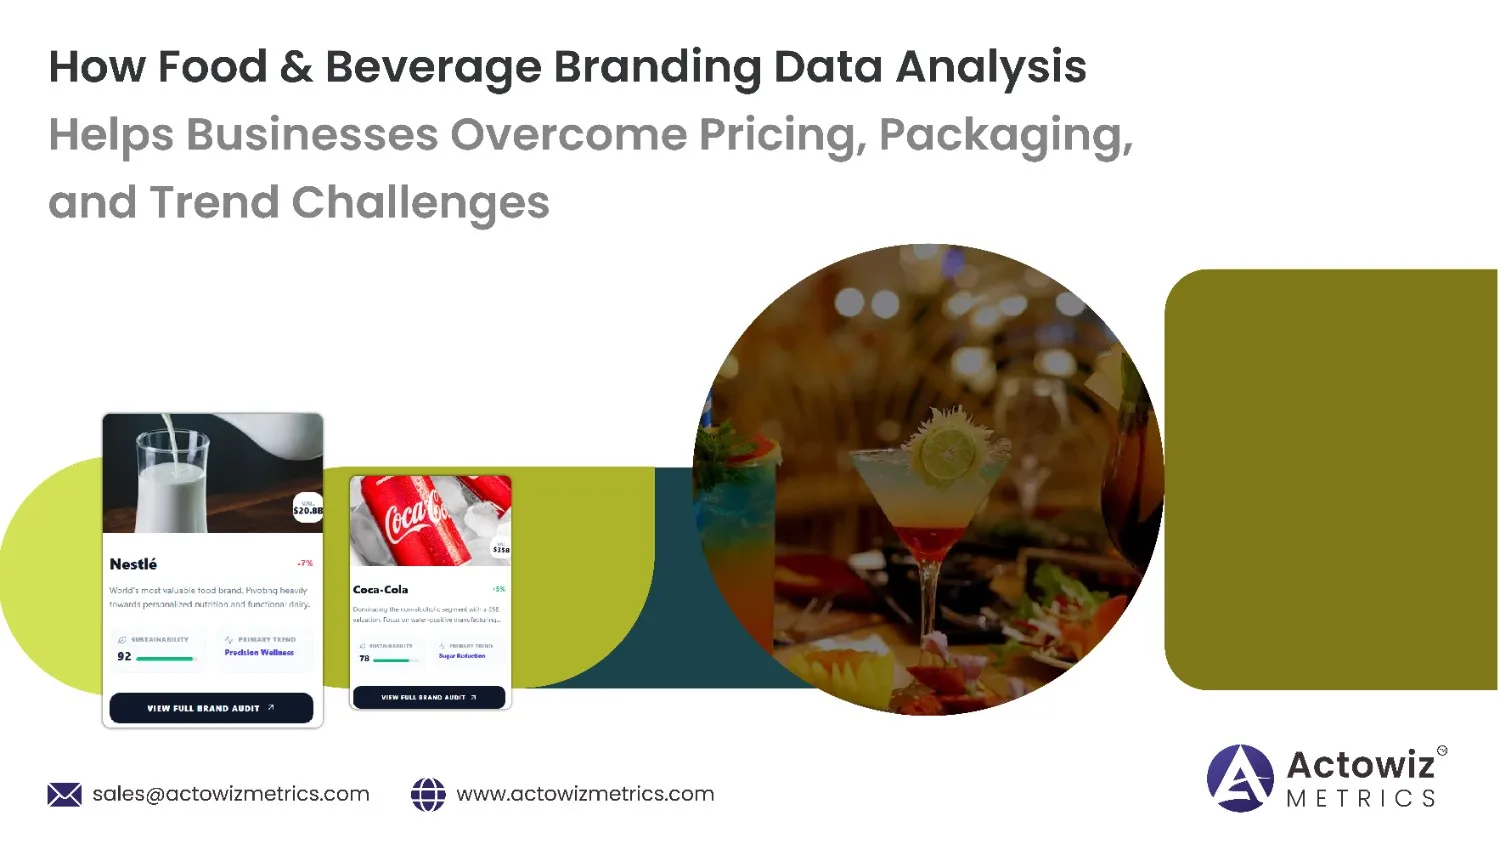
In today’s highly competitive food and beverage market, brands are under constant pressure to balance pricing, improve packaging appeal, and respond quickly to changing consumer preferences. This is where Food & Beverage Branding Data Analysis becomes essential. From shelf placement and promotional trends to package design and digital visibility, data-driven insights help brands make smarter decisions that improve sales and customer loyalty.
Modern businesses are also relying on Food Analytics to understand buyer behavior, regional demand, and category performance. As online and offline competition increases, companies need accurate branding intelligence to identify what works, what fails, and where new opportunities exist. With growing private labels, health-conscious products, and sustainability demands, brands must move beyond assumptions and use structured data for faster action.
According to market studies, the global food and beverage analytics market is expected to grow at over 16% CAGR between 2020 and 2026, driven by rising digital commerce, smart retail shelves, and consumer personalization. Companies that use branding data can improve packaging effectiveness, optimize price positioning, and launch products with greater confidence.
This blog explores how branding data helps solve major industry challenges and how Actowiz Metrics supports brands with advanced intelligence solutions.
Food and beverage brands face fierce rivalry in pricing, promotions, and visual identity. Businesses need accurate insights to understand how competitors position products, launch new SKUs, and attract customers. Using FMCG Food Branding Data Intelligence helps companies uncover shelf trends, price gaps, and campaign effectiveness across regions.
At the same time, Brand Competition Analysis enables businesses to benchmark packaging, flavors, discounts, and customer sentiment. This allows decision-makers to identify strengths and market gaps before competitors capture demand.
Between 2020 and 2026, FMCG food brands increased digital promotional spending by nearly 38%, while private-label food products gained around 24% more shelf visibility in major online marketplaces.
| Year | FMCG Branding Spend Growth | Private Label Shelf Visibility Growth |
|---|---|---|
| 2020 | 8% | 10% |
| 2022 | 14% | 16% |
| 2024 | 20% | 21% |
| 2026 | 26% | 24% |
By analyzing competitor moves, brands can improve pricing strategies, redesign packaging, and better target evolving customer segments.
Food brands must adapt quickly to health trends, sustainability expectations, and convenience-focused buying behavior. Businesses that Extract Food & Beverage Branding Strategies for CPG Brands can understand how successful brands align packaging, messaging, and product positioning with consumer demand.
Data-driven insights reveal important shifts such as clean-label preferences, eco-friendly packaging, portion control, and premiumization trends. These insights help businesses reduce failed launches and improve product-market fit.
From 2020 to 2026, sustainable packaging preference among consumers increased from 31% to 61%, while demand for clean-label products rose by nearly 45%.
| Year | Sustainable Packaging Preference | Clean Label Demand Growth |
|---|---|---|
| 2020 | 31% | 18% |
| 2022 | 42% | 26% |
| 2024 | 54% | 36% |
| 2026 | 61% | 45% |
This intelligence helps food companies align branding efforts with what consumers actually want, resulting in stronger loyalty and higher conversions.
The digital shelf has become a critical battleground for food and beverage brands. Businesses that Scrape Digital Shelf Branding Data for CPG Companies gain valuable insights into product rankings, search visibility, promotional banners, and content quality.
Alongside this, Product Data Tracking helps companies monitor changes in titles, descriptions, packaging images, customer reviews, and stock availability. This allows faster corrections and better campaign performance.
Online grocery sales have grown significantly, with digital shelf competition becoming more intense. Between 2020 and 2026, online food sales contribution is expected to rise from 11% to 28%.
| Year | Online Food Sales Share | Digital Shelf Competition Index |
|---|---|---|
| 2020 | 11% | 100 |
| 2022 | 16% | 135 |
| 2024 | 22% | 168 |
| 2026 | 28% | 210 |
By tracking shelf data in real time, brands can improve discoverability, optimize listings, and protect their digital brand identity.
Packaging and pricing are two of the biggest purchase drivers in food retail. Businesses need visibility into what competitors charge, how package formats evolve, and which branding elements influence conversion.
Through CPG Branding Strategy Data Extraction, companies can collect insights on pack sizes, bundle offers, label claims, promotional pricing, and visual merchandising trends.
Data from 2020 to 2026 shows that brands using packaging optimization analytics improved sales by up to 19%, while dynamic pricing strategies increased revenue margins by 12% on average.
| Year | Packaging Optimization Sales Impact | Dynamic Pricing Margin Improvement |
|---|---|---|
| 2020 | 6% | 4% |
| 2022 | 10% | 7% |
| 2024 | 15% | 10% |
| 2026 | 19% | 12% |
Structured branding intelligence helps businesses reduce packaging waste, improve shelf appeal, and maintain competitive pricing without hurting profitability.
Launching new food products without market intelligence increases failure risk. Businesses need continuous access to competitor launches, flavor innovations, consumer reviews, and seasonal campaign performance.
A robust Food & Beverage Branding Data Scraper helps brands capture launch trends, promotional activity, bundle experiments, and social media buzz in real time.
From 2020 to 2026, food product launch failures declined by nearly 22% among companies using predictive branding analytics.
| Year | New Product Launch Success Rate | Data-Led Campaign Efficiency |
|---|---|---|
| 2020 | 48% | 52% |
| 2022 | 56% | 60% |
| 2024 | 64% | 69% |
| 2026 | 70% | 74% |
This empowers businesses to make faster launch decisions, improve campaign ROI, and stay aligned with changing customer expectations.
Food and beverage trends shift rapidly due to inflation, ingredient costs, health concerns, and social influence. Brands need continuous monitoring to avoid losing relevance.
Using Real-Time Food & Beverage Branding Data Monitoring, businesses can instantly track competitor price changes, packaging redesigns, promotions, and sentiment shifts.
Real-time data has become crucial, especially as food inflation and e-commerce competition impact consumer choices. Studies show that brands using live monitoring reduced response time to market changes by over 40%.
| Year | Average Response Time Reduction | Market Adaptation Efficiency |
|---|---|---|
| 2020 | 12% | 45% |
| 2022 | 22% | 53% |
| 2024 | 33% | 64% |
| 2026 | 41% | 72% |
Continuous intelligence ensures brands can react quickly, maintain customer trust, and improve long-term profitability.
Actowiz Metrics delivers advanced Digital Shelf Analytics solutions that help food and beverage businesses solve branding, pricing, and packaging challenges with precision. Our tailored intelligence services collect real-time data from eCommerce platforms, grocery marketplaces, competitor websites, and retail channels.
With expertise in Food & Beverage Branding Data Analysis, Actowiz Metrics helps businesses:
Our scalable solutions empower food brands, FMCG companies, and CPG leaders to reduce risks, improve customer engagement, and maximize revenue opportunities.
The food and beverage market is evolving rapidly, and businesses can no longer rely on guesswork to solve pricing, packaging, and trend challenges. With Price Benchmarking and advanced Food & Beverage Branding Data Analysis, brands can gain a clear competitive edge, improve customer satisfaction, and drive sustainable growth.
Actowiz Metrics helps businesses transform raw market data into powerful branding intelligence that fuels smarter decisions and faster growth.
Ready to optimize your food and beverage brand strategy? Contact Actowiz Metrics today for customized data intelligence solutions that keep you ahead of the competition.
Expert blogs, research reports and infographics — practical, data-driven reading across e-commerce and quick-commerce.
Most fields are optional — the more you share, the better your sample.


.webp "infographics")
.webp "infographics")


