BLOG


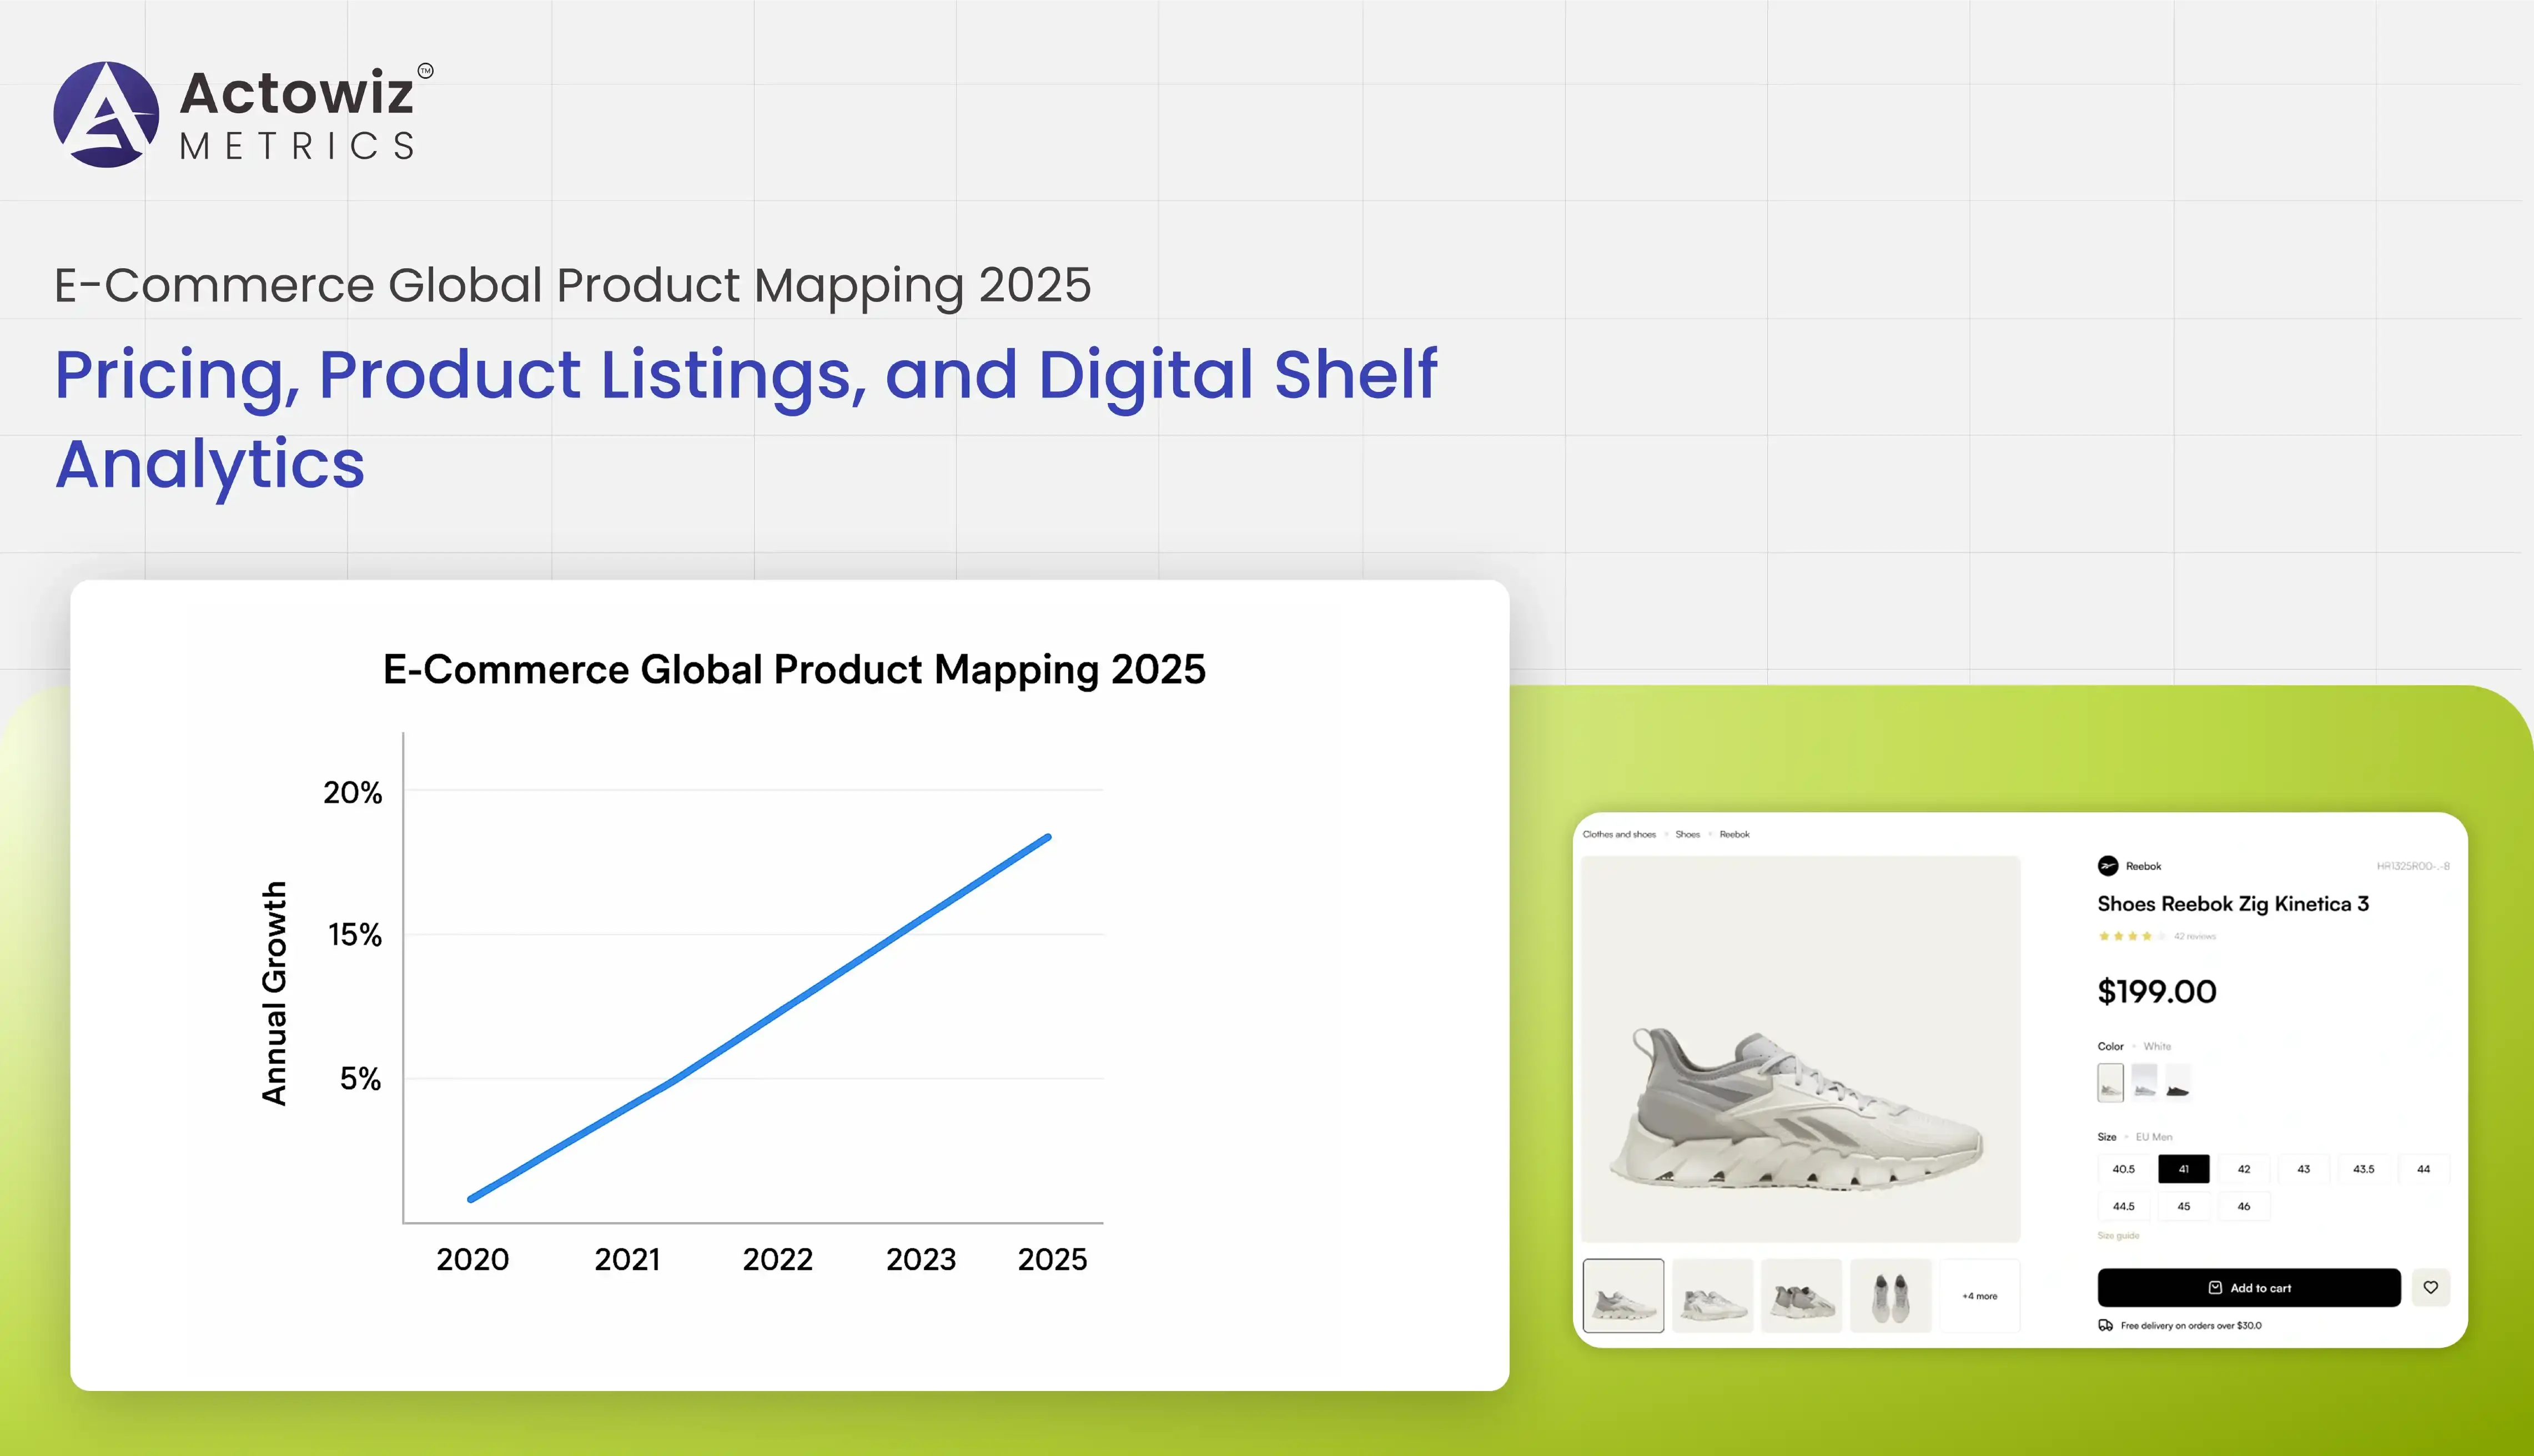
The global e-commerce landscape is rapidly evolving, demanding accurate data and actionable insights for businesses to remain competitive. The E-Commerce Global Product Mapping 2025 report provides an in-depth view of product listings, pricing strategies, and shelf performance across multiple platforms and countries. Leveraging E-commerce Analytics, retailers and brands can monitor assortment trends, benchmark prices, and optimize their digital shelf strategies. From 2020 to 2025, global online product catalogs have grown by an average of 15% annually, highlighting the need for systematic mapping and tracking. Accurate product mapping allows businesses to analyze SKU-level performance, monitor promotions, and assess competitor strategies effectively. This report consolidates historical data, cross-platform insights, and key benchmarks, providing stakeholders with actionable intelligence to make informed decisions and maximize revenue across the global e-commerce ecosystem.
E-Commerce Cross-Platform Product Mapping Analysis 2025 is essential to track product availability, visibility, and digital shelf performance across multiple online marketplaces. By implementing Digital Shelf Analytics, businesses can monitor how products are positioned, priced, and promoted across platforms. From 2020 to 2025, global product visibility improved from 65% to 82%, demonstrating the growing focus on optimized presentation and consistent stock updates.
| Year | Products Mapped (Million) | Avg Product Visibility (%) | Platforms Covered |
|---|---|---|---|
| 2020 | 5.5 | 65 | 12 |
| 2021 | 6.2 | 68 | 14 |
| 2022 | 6.9 | 71 | 16 |
| 2023 | 7.7 | 75 | 18 |
| 2024 | 8.5 | 79 | 20 |
| 2025 | 9.4 | 82 | 22 |
This data helps businesses optimize online shelf placement, enhance visibility, and track category trends globally.
The Cross-Market Product Mapping Benchmark Study 2025 evaluates pricing, availability, and promotions across global markets. Price Benchmarking enables retailers to monitor competitors and adjust strategies to maximize profitability. Between 2020 and 2025, average price deviations across platforms ranged from 6% to 14%, reflecting differences in regional pricing and market positioning.
| Year | Avg Price Deviation (%) | Promotions Tracked | Countries Monitored |
|---|---|---|---|
| 2020 | 6.0 | 1,200 | 10 |
| 2021 | 7.2 | 1,400 | 12 |
| 2022 | 8.5 | 1,600 | 14 |
| 2023 | 10.0 | 1,900 | 16 |
| 2024 | 12.0 | 2,100 | 18 |
| 2025 | 14.0 | 2,400 | 20 |
Benchmarking ensures competitive pricing, optimized promotions, and enhanced cross-market strategy execution.
Cross-Country E-Commerce Product Mapping Insights allow businesses to track competitor assortments, SKUs, and marketing strategies across regions. Brand Competition Analysis highlights performance gaps, market share shifts, and category-level trends. From 2020 to 2025, the number of SKUs monitored across top global e-commerce platforms grew from 3.5 million to 7.2 million.
| Year | SKUs Monitored (Million) | Brands Tracked | Active Promotions |
|---|---|---|---|
| 2020 | 3.5 | 850 | 1,100 |
| 2021 | 4.1 | 900 | 1,250 |
| 2022 | 4.8 | 950 | 1,400 |
| 2023 | 5.6 | 1,050 | 1,600 |
| 2024 | 6.4 | 1,150 | 1,800 |
| 2025 | 7.2 | 1,250 | 2,000 |
These insights help brands identify gaps, optimize product assortments, and implement competitive strategies effectively.
E-Commerce Industry Product Mapping and Price Tracking ensures consistent monitoring of SKU-level data across global platforms. Product Data Tracking allows businesses to capture price changes, stock levels, and promotional activities in real-time. Between 2020 and 2025, the volume of tracked products increased from 4.2 million to 8.9 million globally, showing the exponential growth in e-commerce product catalogs.
| Year | Products Tracked (Million) | Price Updates Recorded | Platforms Covered |
|---|---|---|---|
| 2020 | 4.2 | 1,500,000 | 12 |
| 2021 | 4.9 | 1,700,000 | 14 |
| 2022 | 5.7 | 1,900,000 | 16 |
| 2023 | 6.5 | 2,200,000 | 18 |
| 2024 | 7.7 | 2,500,000 | 20 |
| 2025 | 8.9 | 2,800,000 | 22 |
Tracking product data accurately helps retailers optimize pricing, inventory, and promotions across all major e-commerce channels.
The E-Commerce Global Product Mapping 2025 report also focuses on maintaining pricing compliance. MAP Monitoring ensures adherence to minimum advertised prices and prevents unauthorized discounting. Between 2020 and 2025, MAP violations reduced by 18% globally as automated monitoring tools became more widespread.
| Year | Platforms Monitored | MAP Violations Detected | Corrective Actions Taken |
|---|---|---|---|
| 2020 | 15 | 1,400 | 1,100 |
| 2021 | 16 | 1,350 | 1,150 |
| 2022 | 18 | 1,250 | 1,200 |
| 2023 | 20 | 1,150 | 1,250 |
| 2024 | 22 | 1,050 | 1,300 |
| 2025 | 25 | 950 | 1,350 |
MAP monitoring strengthens brand control, ensures pricing integrity, and protects profitability in global markets.
The E-Commerce Global Product Mapping 2025 report consolidates insights from all regions, highlighting SKU-level assortment, pricing trends, and digital shelf performance. Between 2020 and 2025, the global e-commerce product catalog expanded from 8 million to 16.5 million SKUs, emphasizing the importance of systematic mapping and tracking for competitive advantage.
| Year | Products Mapped (Million) | Promotions Tracked | Avg Product Visibility (%) |
|---|---|---|---|
| 2020 | 8.0 | 2,500,000 | 65 |
| 2021 | 9.2 | 2,800,000 | 68 |
| 2022 | 11.0 | 3,100,000 | 71 |
| 2023 | 12.5 | 3,400,000 | 74 |
| 2024 | 14.5 | 3,700,000 | 78 |
| 2025 | 16.5 | 4,000,000 | 82 |
Comprehensive mapping allows businesses to benchmark performance, track trends, and optimize strategies across global markets.
Actowiz Metrics provides advanced capabilities for Product Data Tracking, enabling retailers to systematically extract product listings, monitor pricing and promotions, and analyze SKU-level performance globally. Our tools allow automated data collection across multiple platforms, competitive benchmarking, and actionable insights that drive strategic decisions. Retailers leveraging Actowiz can identify market gaps, maintain pricing integrity, optimize digital shelf visibility, and maximize revenue across e-commerce markets worldwide. With these solutions, businesses gain real-time intelligence to stay competitive, improve assortment planning, and enhance operational efficiency.
Actowiz Metrics provides advanced capabilities for Product Data Tracking, enabling retailers to systematically extract product listings, monitor pricing and promotions, and analyze SKU-level performance globally. Our tools allow automated data collection across multiple platforms, competitive benchmarking, and actionable insights that drive strategic decisions. Retailers leveraging Actowiz can identify market gaps, maintain pricing integrity, optimize digital shelf visibility, and maximize revenue across e-commerce markets worldwide. With these solutions, businesses gain real-time intelligence to stay competitive, improve assortment planning, and enhance operational efficiency.
Expert blogs, research reports and infographics — practical, data-driven reading across e-commerce and quick-commerce.
Most fields are optional — the more you share, the better your sample.


.webp "infographics")
.webp "infographics")


