BLOG




















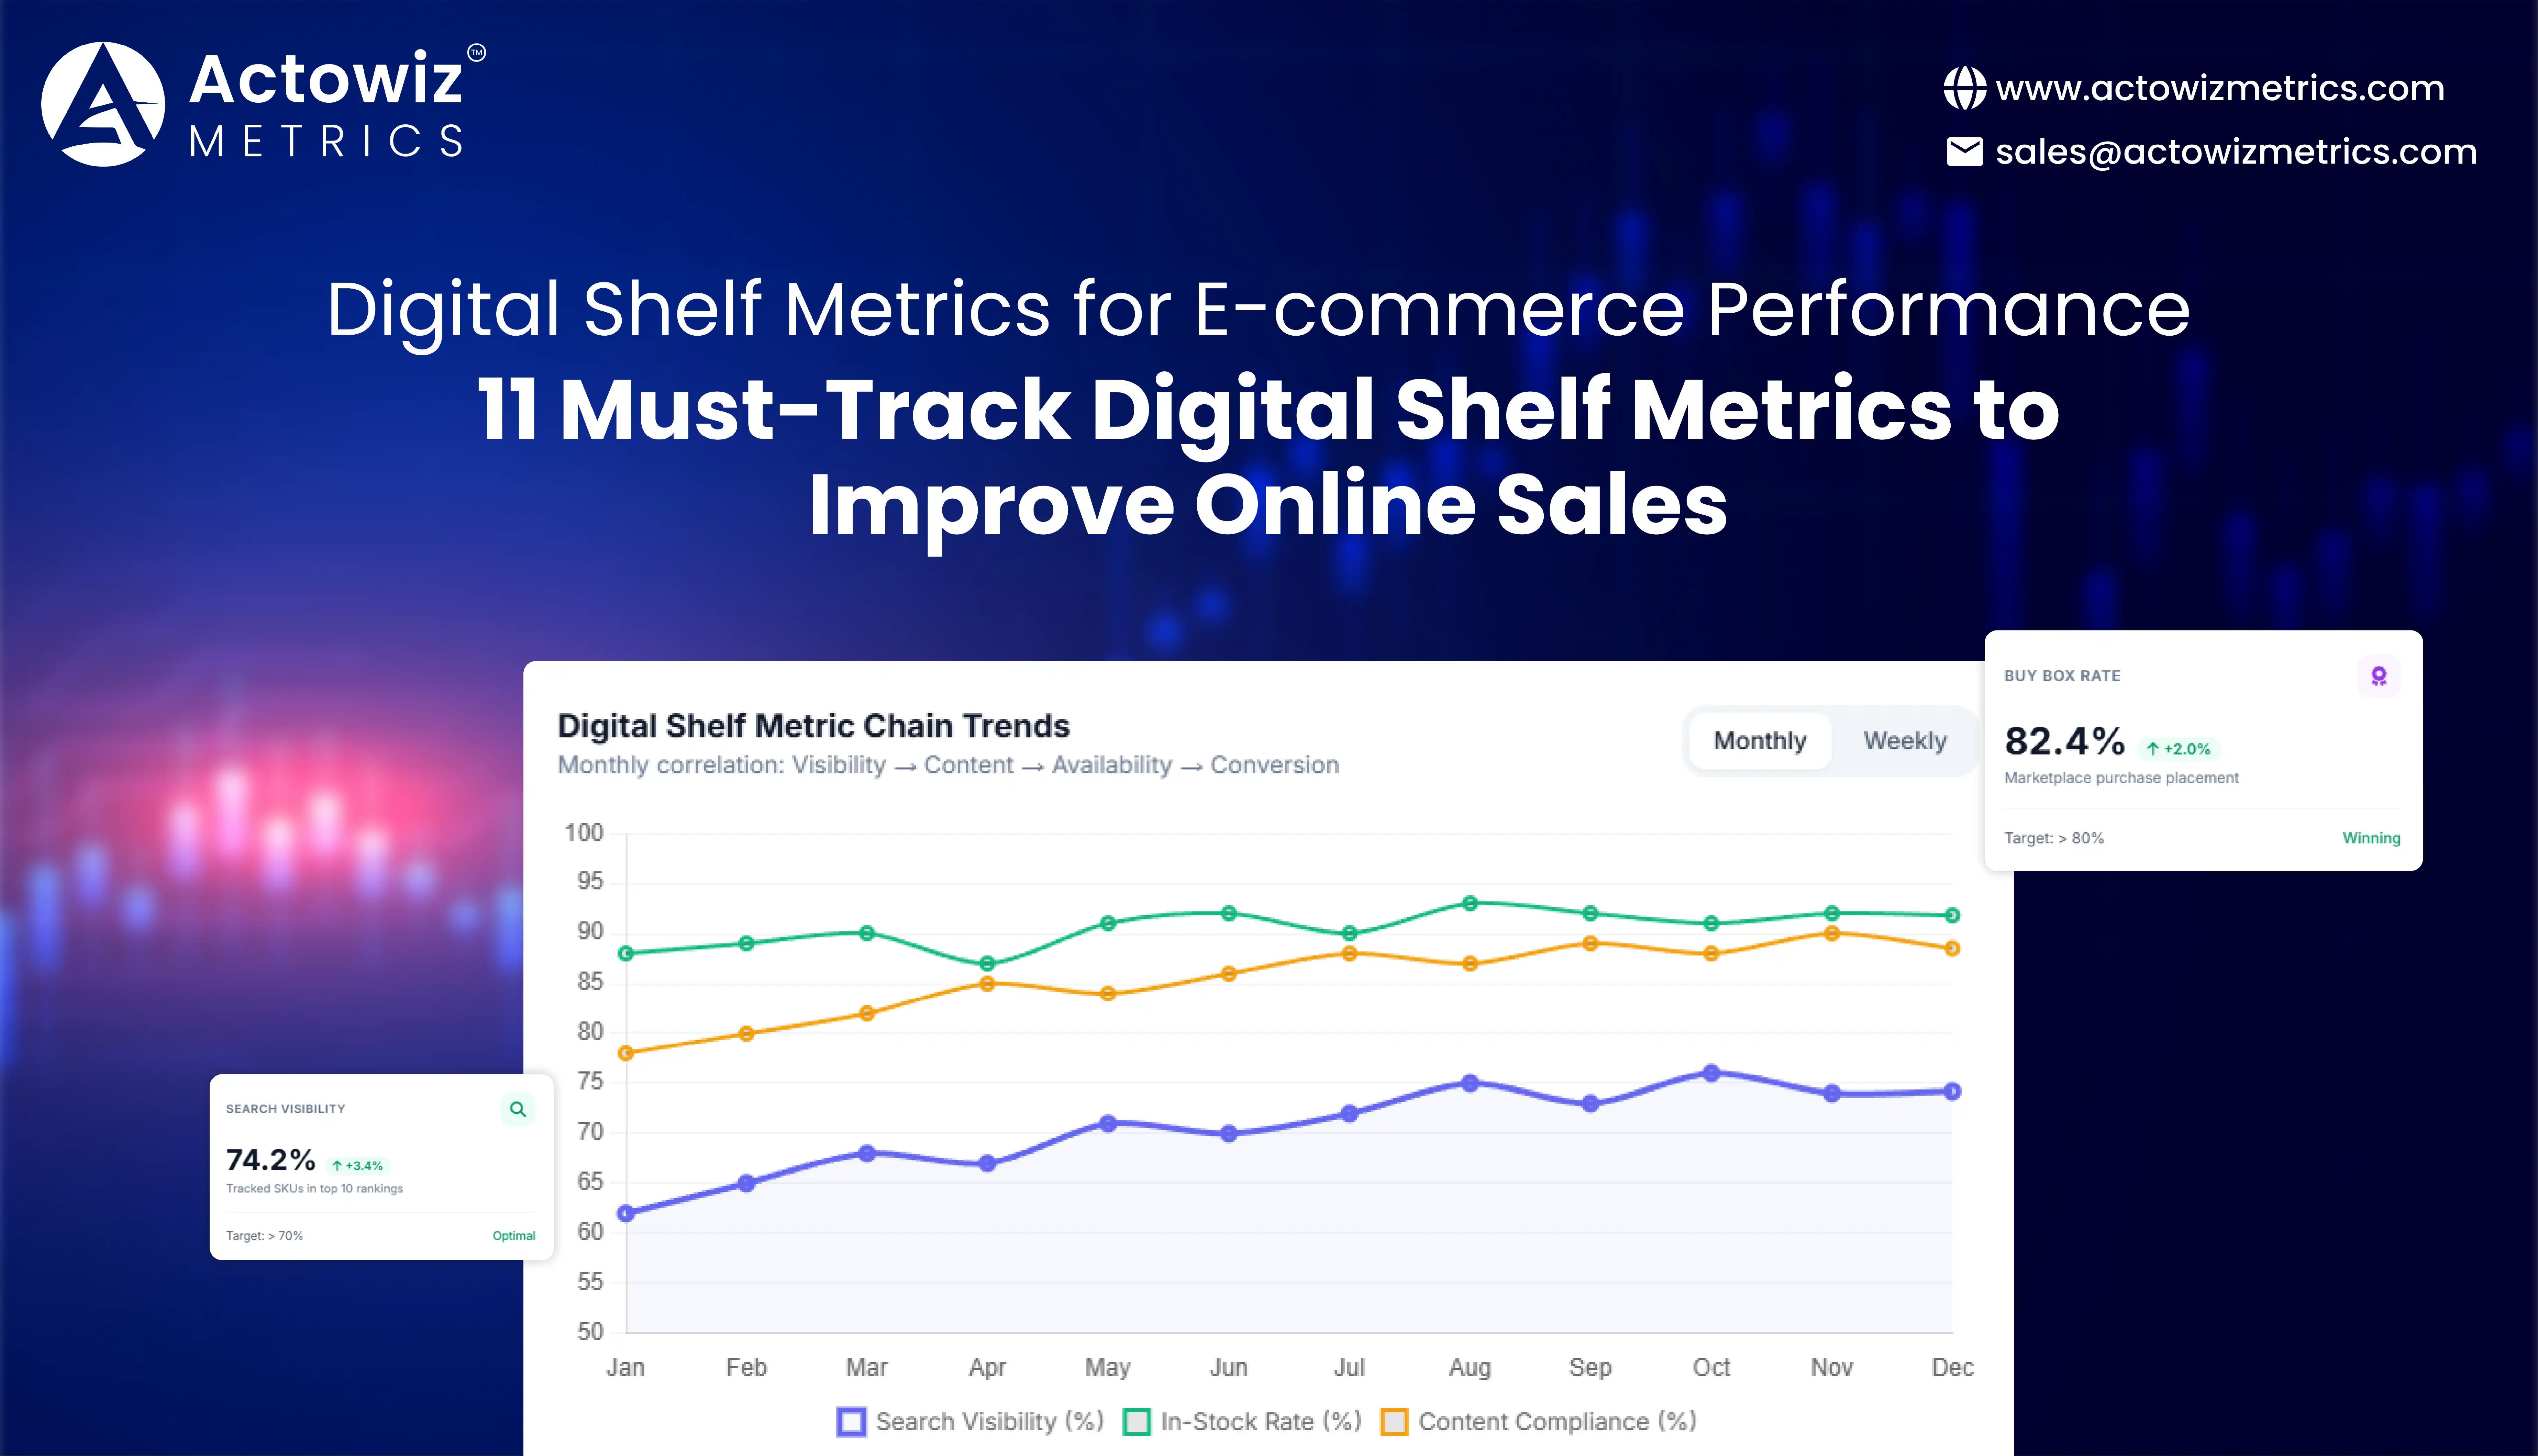
The fastest way to improve online sales is to measure what shoppers actually see and experience: product visibility, content quality, availability, pricing, search presence, and conversion signals. Digital Shelf Metrics for E-commerce Performance turn these signals into measurable actions, while Digital Shelf Analytics helps brands identify where products are losing visibility, shoppers are encountering friction, or competitors are gaining ground.
The digital shelf has become a critical commercial environment rather than simply an online product catalog. Carrefour, for example, reported €5.9 billion in global e-commerce GMV in 2024, representing 18% growth from 2023. Its 2025 reporting showed another 21% increase in e-commerce GMV.
For FMCG manufacturers, retailers, marketplace sellers, and e-commerce teams, this creates a practical challenge: How can teams determine whether weak online sales are caused by poor visibility, missing content, stockouts, uncompetitive prices, or weak conversion performance?
The answer is to monitor a connected set of digital shelf metrics rather than relying on revenue alone.
This article explains 11 must-track metrics, how to calculate them, what they reveal, and how brands can use them to improve online execution.
Digital Shelf Performance Analytics provides the foundation for understanding whether products are visible, competitive, available, and correctly represented across online channels. The most useful measurement framework combines discovery, content, availability, pricing, conversion, and competitive indicators.
| Metric | What It Measures | Business Question |
|---|---|---|
| Search Visibility | Product presence in relevant searches | Can shoppers find the product? |
| Share of Search | Brand visibility versus competitors | How much category search space does the brand capture? |
| Product Content Completeness | Availability of required attributes | Is enough information available to support purchase decisions? |
| Content Compliance | Alignment with brand/content standards | Are listings following approved requirements? |
| Product Availability | Whether products can currently be purchased | Is the product actually sellable? |
| Out-of-Stock Rate | Frequency of unavailable products | How often are sales opportunities lost to stockouts? |
| Price Index | Price relative to competitors | Is the product competitively priced? |
| Buy Box Rate | Frequency of winning marketplace purchase placement | How often does the brand control the main purchase opportunity? |
| Rating & Review Health | Customer feedback and social proof | Does customer sentiment support conversion? |
| Promotion Presence | Visibility of discounts and offers | Are promotions appearing correctly online? |
| Sales/Conversion Rate | Ability of traffic to generate purchases | Are shoppers converting after reaching the product? |
These metrics should not operate independently. A product can have strong search visibility but weak content. It can have excellent content but be out of stock. It can be available and well presented but priced substantially above competitors.
The goal is therefore to build a metric chain:
Visibility → Content → Availability → Price → Shopper Engagement → Conversion
Baymard's 2026 Product Page UX research illustrates why this chain matters. Its benchmark found that only 48% of leading desktop e-commerce sites had a "decent" or "good" overall product-page UX performance, while 38% reached that level on mobile.
From 2020 through 2026, e-commerce moved from being an additional sales channel toward becoming an increasingly integrated part of retail operations. The pandemic accelerated online shopping adoption, but the longer-term shift has been broader: consumers now compare products, prices, availability, ratings, and promotions across multiple digital touchpoints before purchasing. Carrefour's own digital strategy describes a "data-centric, digital first" approach built around e-commerce, data and retail media, digital services, and digital transformation of traditional retail. By 2025, Carrefour reported 15,719 stores and e-commerce sites serving 80 million customer households annually, while e-commerce GMV grew 21%. At the same time, the U.S. Census Bureau estimated $316.1 billion in seasonally adjusted retail e-commerce sales for Q4 2025, representing 16.6% of total retail sales for the quarter. These developments make shelf-level measurement increasingly important. A sales report can tell a brand that revenue declined, but digital shelf measurement can identify whether search visibility fell, content became incomplete, products went out of stock, or competitor pricing changed. That diagnostic capability is especially valuable to category managers, e-commerce directors, marketplace managers, and brand teams responsible for thousands of SKUs across multiple retailers.
Ecommerce Product Visibility and Share of Search Metrics show whether products are discoverable where consumers are actively looking.
A brand should monitor visibility across:
| Metric | Example Measurement | Why It Matters |
|---|---|---|
| Search Rank | Position 1, 5, 15, etc. | Identifies ranking movement |
| Search Visibility | % of tracked searches where SKU appears | Measures discoverability |
| Share of Search | Brand results ÷ total tracked results | Measures competitive presence |
| Category Presence | SKUs appearing in category pages ÷ tracked SKUs | Reveals assortment visibility |
| Sponsored Visibility | Paid placements captured | Shows advertising presence |
Baymard's 2025 product-list research found that 58% of desktop e-commerce sites and 78% of mobile sites had "poor" to "mediocre" overall product-list UX performance.
For brands, the practical lesson is that being listed is not enough. Products must be easy to find and compare.
Example: If a detergent brand tracks 100 category and search terms and its products appear in only 55 of them, the team has a measurable visibility gap. The next step is to identify whether the problem comes from search ranking, missing attributes, weak keyword relevance, assortment gaps, or retailer merchandising.
Between 2020 and 2026, product discovery increasingly shifted toward digital search, category navigation, marketplaces, retailer apps, and personalized recommendations. Consumers can compare several sellers within seconds, meaning brands compete not only on product quality but also on digital discoverability. Baymard's research found that 50% of e-commerce sites fail to display an adequate balance of important product-list attributes, while five universal attributes—price, product title/type, thumbnail, ratings, and variations—are particularly important for product selection. For category managers, this means search visibility should be tracked at SKU and keyword level instead of relying on broad traffic figures. A brand may receive strong overall website traffic while individual high-value SKUs disappear from critical searches. Tracking search visibility over time makes those changes measurable. It also allows teams to compare brands, retailers, categories, and geographic markets using the same measurement framework. In 2026, this becomes even more relevant as AI-assisted discovery and conversational shopping introduce additional routes through which consumers can find products. Carrefour's 2025 annual reporting noted that 34% of consumers already used AI to search for products and 33% to compare them.
Product content is one of the easiest areas to overlook because a SKU can remain technically "live" while important information is missing.
Digital Shelf Content Compliance Monitoring helps brands determine whether product pages meet defined content standards across retailers and marketplaces.
Track:
| Content Element | Measurement | Action |
|---|---|---|
| Title | Required fields present | Correct missing attributes |
| Images | Required image set available | Replace incomplete galleries |
| Description | Minimum information present | Expand weak descriptions |
| Attributes | Required fields populated | Fill missing specifications |
| Brand Claims | Approved claims present | Correct inconsistent messaging |
| Variants | Size/color/pack details accurate | Fix variation mapping |
Baymard's research found that 10% of the largest e-commerce sites failed to maintain consistently detailed product descriptions, with insufficient information sometimes causing shoppers to abandon products.
For a large catalog, manual checking is inefficient. A brand can instead create a content compliance rule set and automatically flag SKUs that fail required conditions.
Product content evolved significantly between 2020 and 2026. Early e-commerce programs often focused on getting product listings online. As digital competition increased, the emphasis shifted toward structured, complete, consistent, and channel-specific content. This change is supported by usability research showing that shoppers depend heavily on product pages and product-list information to evaluate products. Baymard's 2023 research found that 50% of e-commerce sites failed to display adequate product-list attributes, while its more recent research continues to identify widespread product-page and product-list usability problems. For brands, content measurement should therefore move beyond a simple "listing complete" status. Teams should measure attribute completeness, image compliance, title structure, descriptions, variation accuracy, and retailer-specific requirements. A useful operating model is to assign every SKU a content status such as compliant, partially compliant, or non-compliant, then connect those results to traffic and conversion data. This allows teams to determine whether content improvements are producing measurable commercial outcomes rather than treating content as an administrative task.
A product cannot convert when shoppers cannot purchase it.
Product Availability and Out-of-Stock Monitoring should therefore be treated as a core digital commerce performance function.
Key measures include:
| Metric | Example Business Use |
|---|---|
| In-stock rate | Compare retailer execution |
| OOS rate | Identify availability problems |
| OOS duration | Prioritize persistent issues |
| Geographic availability | Detect regional gaps |
| SKU availability | Identify vulnerable products |
| Fulfillment availability | Compare delivery/pickup options |
For FMCG brands, availability should be monitored alongside price and visibility. A sudden ranking decline can have several explanations, but persistent stockouts are an obvious operational signal.
From 2020 to 2026, availability became increasingly connected to the overall customer experience. Consumers can move between websites, apps, stores, pickup services, and delivery platforms during the same shopping journey. Carrefour's 2024 reporting described an omnichannel network combining its physical stores with online operations, including 3,238 Drives and €5.9 billion in global e-commerce GMV. Its 2025 reporting also described continued e-commerce growth and an expanded omnichannel model. This means availability cannot be evaluated only at the national catalog level. A product can be available somewhere but unavailable to a shopper in a particular location or fulfillment channel. For category managers, monitoring should therefore capture SKU, retailer, location, fulfillment method, and timestamp wherever the data is available. Historical availability records are particularly useful because they reveal recurring stockouts, seasonal shortages, retailer-specific problems, and differences between promotional periods and normal trading periods. This gives supply-chain, sales, and e-commerce teams a common evidence base for investigating lost digital sales opportunities.
Price remains one of the most visible elements of a product listing. However, a simple price comparison is not enough.
Ecommerce Price Competitiveness and Buy Box Analytics should combine:
| Metric | Formula / Measurement |
|---|---|
| Price Index | Brand price ÷ competitor benchmark × 100 |
| Discount % | (Regular price − selling price) ÷ regular price × 100 |
| Price Gap | Brand price − competitor price |
| Buy Box Rate | Buy Box wins ÷ eligible observations × 100 |
| Promotion Frequency | Promotional observations ÷ total observations |
| Unit Price Gap | Brand unit price − competitor unit price |
A price index of 100 means the observed price equals the selected benchmark. A figure above or below 100 indicates a relative price difference; the business interpretation depends on category, brand positioning, promotion strategy, and retailer economics.
The period from 2020 through 2026 saw greater emphasis on price transparency, promotions, marketplace competition, and digital price monitoring. Carrefour's reporting demonstrates the scale of this shift: its 2024 e-commerce GMV reached €5.9 billion, while 2025 e-commerce GMV grew another 21%. At this scale, manual price checks cannot provide sufficient historical coverage across products and channels. Automated monitoring can instead capture price observations at scheduled intervals and associate them with availability, promotions, seller information, and product identifiers. This allows teams to distinguish a short-term promotion from a sustained price movement. It also creates a historical evidence base for assessing price changes around campaigns, holidays, launches, and competitor activity. Marketplace sellers can add Buy Box observations to understand whether price, availability, fulfillment, seller status, or other marketplace factors coincide with changes in purchase placement. The objective is not simply to become the cheapest seller. Instead, teams can establish rules around target price positioning, promotional thresholds, minimum margins, and competitive response windows.
Digital Shelf Data Scraping for Ecommerce Analytics allows brands to transform publicly visible product information into structured datasets for monitoring and analysis, subject to applicable website terms, laws, and access restrictions.
A structured collection program can capture:
| Data Layer | Output | Business Application |
|---|---|---|
| Collection | Raw product observations | Build a monitoring base |
| Normalization | Standardized fields | Compare retailers |
| Matching | Common SKU/product IDs | Track products consistently |
| Validation | Error-checked records | Improve reliability |
| Historical storage | Time-series observations | Detect changes |
| Analytics | Dashboards and alerts | Support decisions |
The critical principle is consistency. If product names, pack sizes, units, seller names, or SKUs are not normalized, comparisons can become misleading.
For example, a 500 ml product should not automatically be treated as equivalent to a 1-liter product simply because the product names are similar. Product matching should consider brand, product identifier, pack size, variant, and other relevant attributes.
Between 2020 and 2026, digital commerce teams increasingly moved from manually prepared spreadsheets toward automated, recurring data pipelines. The reason is straightforward: online product information changes continuously. Prices change, products go out of stock, promotions start and end, sellers change, ratings accumulate, and search rankings move. Carrefour's own strategy highlights the increasing role of data and technology within its digital retail model, while its 2025 annual reporting describes continued adoption of AI and data-driven technologies. A modern data pipeline should therefore preserve historical observations rather than overwrite yesterday's values with today's values. This creates a time-series dataset that can support price benchmarking, availability analysis, content compliance, competitive monitoring, and digital shelf reporting. For enterprise brands managing thousands of SKUs across multiple retailers, automation also creates consistency: the same fields can be collected, normalized, validated, and delivered at predefined intervals. The result is a reusable analytical foundation rather than a one-time data export.
Competitor Analysis for Brands becomes more effective when digital shelf data is connected across visibility, content, availability, pricing, and promotional signals.
Actowiz Metrics can help e-commerce and brand teams build structured monitoring programs around their specific retailer and marketplace environments.
What the workflow can include
1. Define the SKU universe
Identify priority products, competitors, categories, retailers, marketplaces, locations, and search terms.
2. Establish measurement rules
Define what counts as available, compliant, visible, competitively priced, or promotion-ready.
3. Collect recurring observations
Capture product and competitive information at scheduled intervals.
4. Normalize product records
Standardize SKU IDs, brands, categories, pack sizes, sellers, units, and price fields.
5. Build historical datasets
Preserve observations so teams can analyze changes rather than isolated snapshots.
6. Create dashboards and alerts
Surface meaningful changes such as sudden price gaps, disappearing SKUs, stockouts, ranking declines, and content failures.
7. Connect insights to business actions
Route findings to pricing, supply chain, content, sales, category management, or marketing teams.
The advantage is a unified view of the digital shelf instead of separate spreadsheets for pricing, availability, content, and competitor activity.
| Buyer Persona | Primary Pain Point | Useful Output |
|---|---|---|
| E-commerce Director | Declining online sales | Cross-channel performance dashboard |
| Category Manager | Competitor movements | SKU and category benchmarks |
| Brand Manager | Weak product visibility | Search and content monitoring |
| Pricing Manager | Price changes | Historical price intelligence |
| Sales Team | Retailer execution gaps | Retailer-level scorecards |
| Supply Chain Team | Online stockouts | Availability alerts |
This approach is particularly valuable for organizations managing large catalogs where manual checks cannot provide consistent coverage.
Strategies for Smart Pricing & Promotion should not be separated from digital shelf execution. A promotion can create traffic but fail to convert if the product is unavailable. A price reduction can improve competitiveness but have limited impact if the SKU is difficult to find. Strong content can support conversion but cannot compensate for persistent stockouts.
The most useful operating model is therefore a connected dashboard.
| Priority | Metric Group | Primary Action |
|---|---|---|
| 1 | Visibility | Fix discoverability gaps |
| 2 | Availability | Resolve stock issues |
| 3 | Content | Correct incomplete listings |
| 4 | Price | Review competitive position |
| 5 | Promotion | Validate offer execution |
| 6 | Conversion | Connect shelf changes to outcomes |
Teams should also establish alert thresholds rather than expecting managers to inspect every SKU manually.
For example:
These rules turn monitoring into an operating process rather than another reporting exercise.
Digital Shelf Metrics for E-commerce Performance give e-commerce teams a structured way to identify the operational causes behind online sales changes. Instead of looking only at revenue, brands can connect search visibility, content quality, availability, pricing, promotions, marketplace placement, and conversion signals.
The most important principle is to treat the digital shelf as a continuously changing commercial environment.
For brands selling through multiple retailers and marketplaces, historical data is especially valuable. It allows teams to distinguish temporary changes from persistent problems, compare retailer execution, identify competitive movements, and prioritize the SKUs that require intervention.
The shift toward data-centric retail is already visible in major retail organizations. Carrefour reported 21% e-commerce GMV growth in 2025 and continues to position data, technology, and AI as important elements of its digital retail model.
The opportunity for brands is to apply the same principle at the product level: measure what shoppers see, identify what is changing, and connect every shelf signal to a business action.
Build a reliable digital shelf intelligence system with Actowiz Metrics to monitor product visibility, availability, content, pricing, promotions, and competitor movements across your priority e-commerce channels!
Expert blogs, research reports and infographics — practical, data-driven reading across e-commerce and quick-commerce.
Most fields are optional — the more you share, the better your sample.


.webp "infographics")
.webp "infographics")