BLOG


Every second, billions of data points are generated across the internet — prices, product listings, reviews, inventory updates, travel fares, property values, and more. Businesses scrape this publicly available data to gain insights, but raw CSV files and API feeds aren’t enough to make quick, data-driven decisions.
Without dashboarding scraped data, businesses face:
Actowiz Metrics bridges this gap by building real-time scraped data dashboards that:
In the USA market, where competition in retail, e-commerce, travel, and real estate is intense, these dashboards are essential for staying ahead.
Before diving into solutions, let’s understand why scraped data often becomes a bottleneck instead of a driver.
Scraped datasets can contain:
Example: A USA electronics retailer scraping competitor prices every 15 minutes may generate over 96 data snapshots daily per product.
Data scraped from multiple sites often comes in:
Without data standardization, dashboard visualization becomes messy and unreliable.
Data is often scattered across:
Without a centralized API-driven dashboard, teams waste time finding, cleaning, and merging data.
To overcome these challenges, Actowiz Metrics uses a three-phase approach.
Actowiz Metrics specializes in scraping data dashboards that connect to real-time feeds from:
Data processing steps include:
1. Deduplication :Removing repeated entries
2. Currency conversion : Standardizing prices to USD for USA clients
3. Product normalization :Ensuring “iPhone 14 128GB” is not mixed with “Apple iPhone XIV 128 GB”
4. Date-time formatting :Aligning all timestamps to EST or PST for consistency
Instead of manual CSV uploads, Actowiz Metrics implements API-driven dashboarding:
Example workflow:
The e-commerce scraped data dashboard design includes:
Key Metrics Section : Average price difference, stock availability, competitor lowest price
Trend Visuals : Line graphs showing 7-day, 30-day price trends
Filters : By product category, competitor, date range
Alerts : Slack/email notifications for significant changes
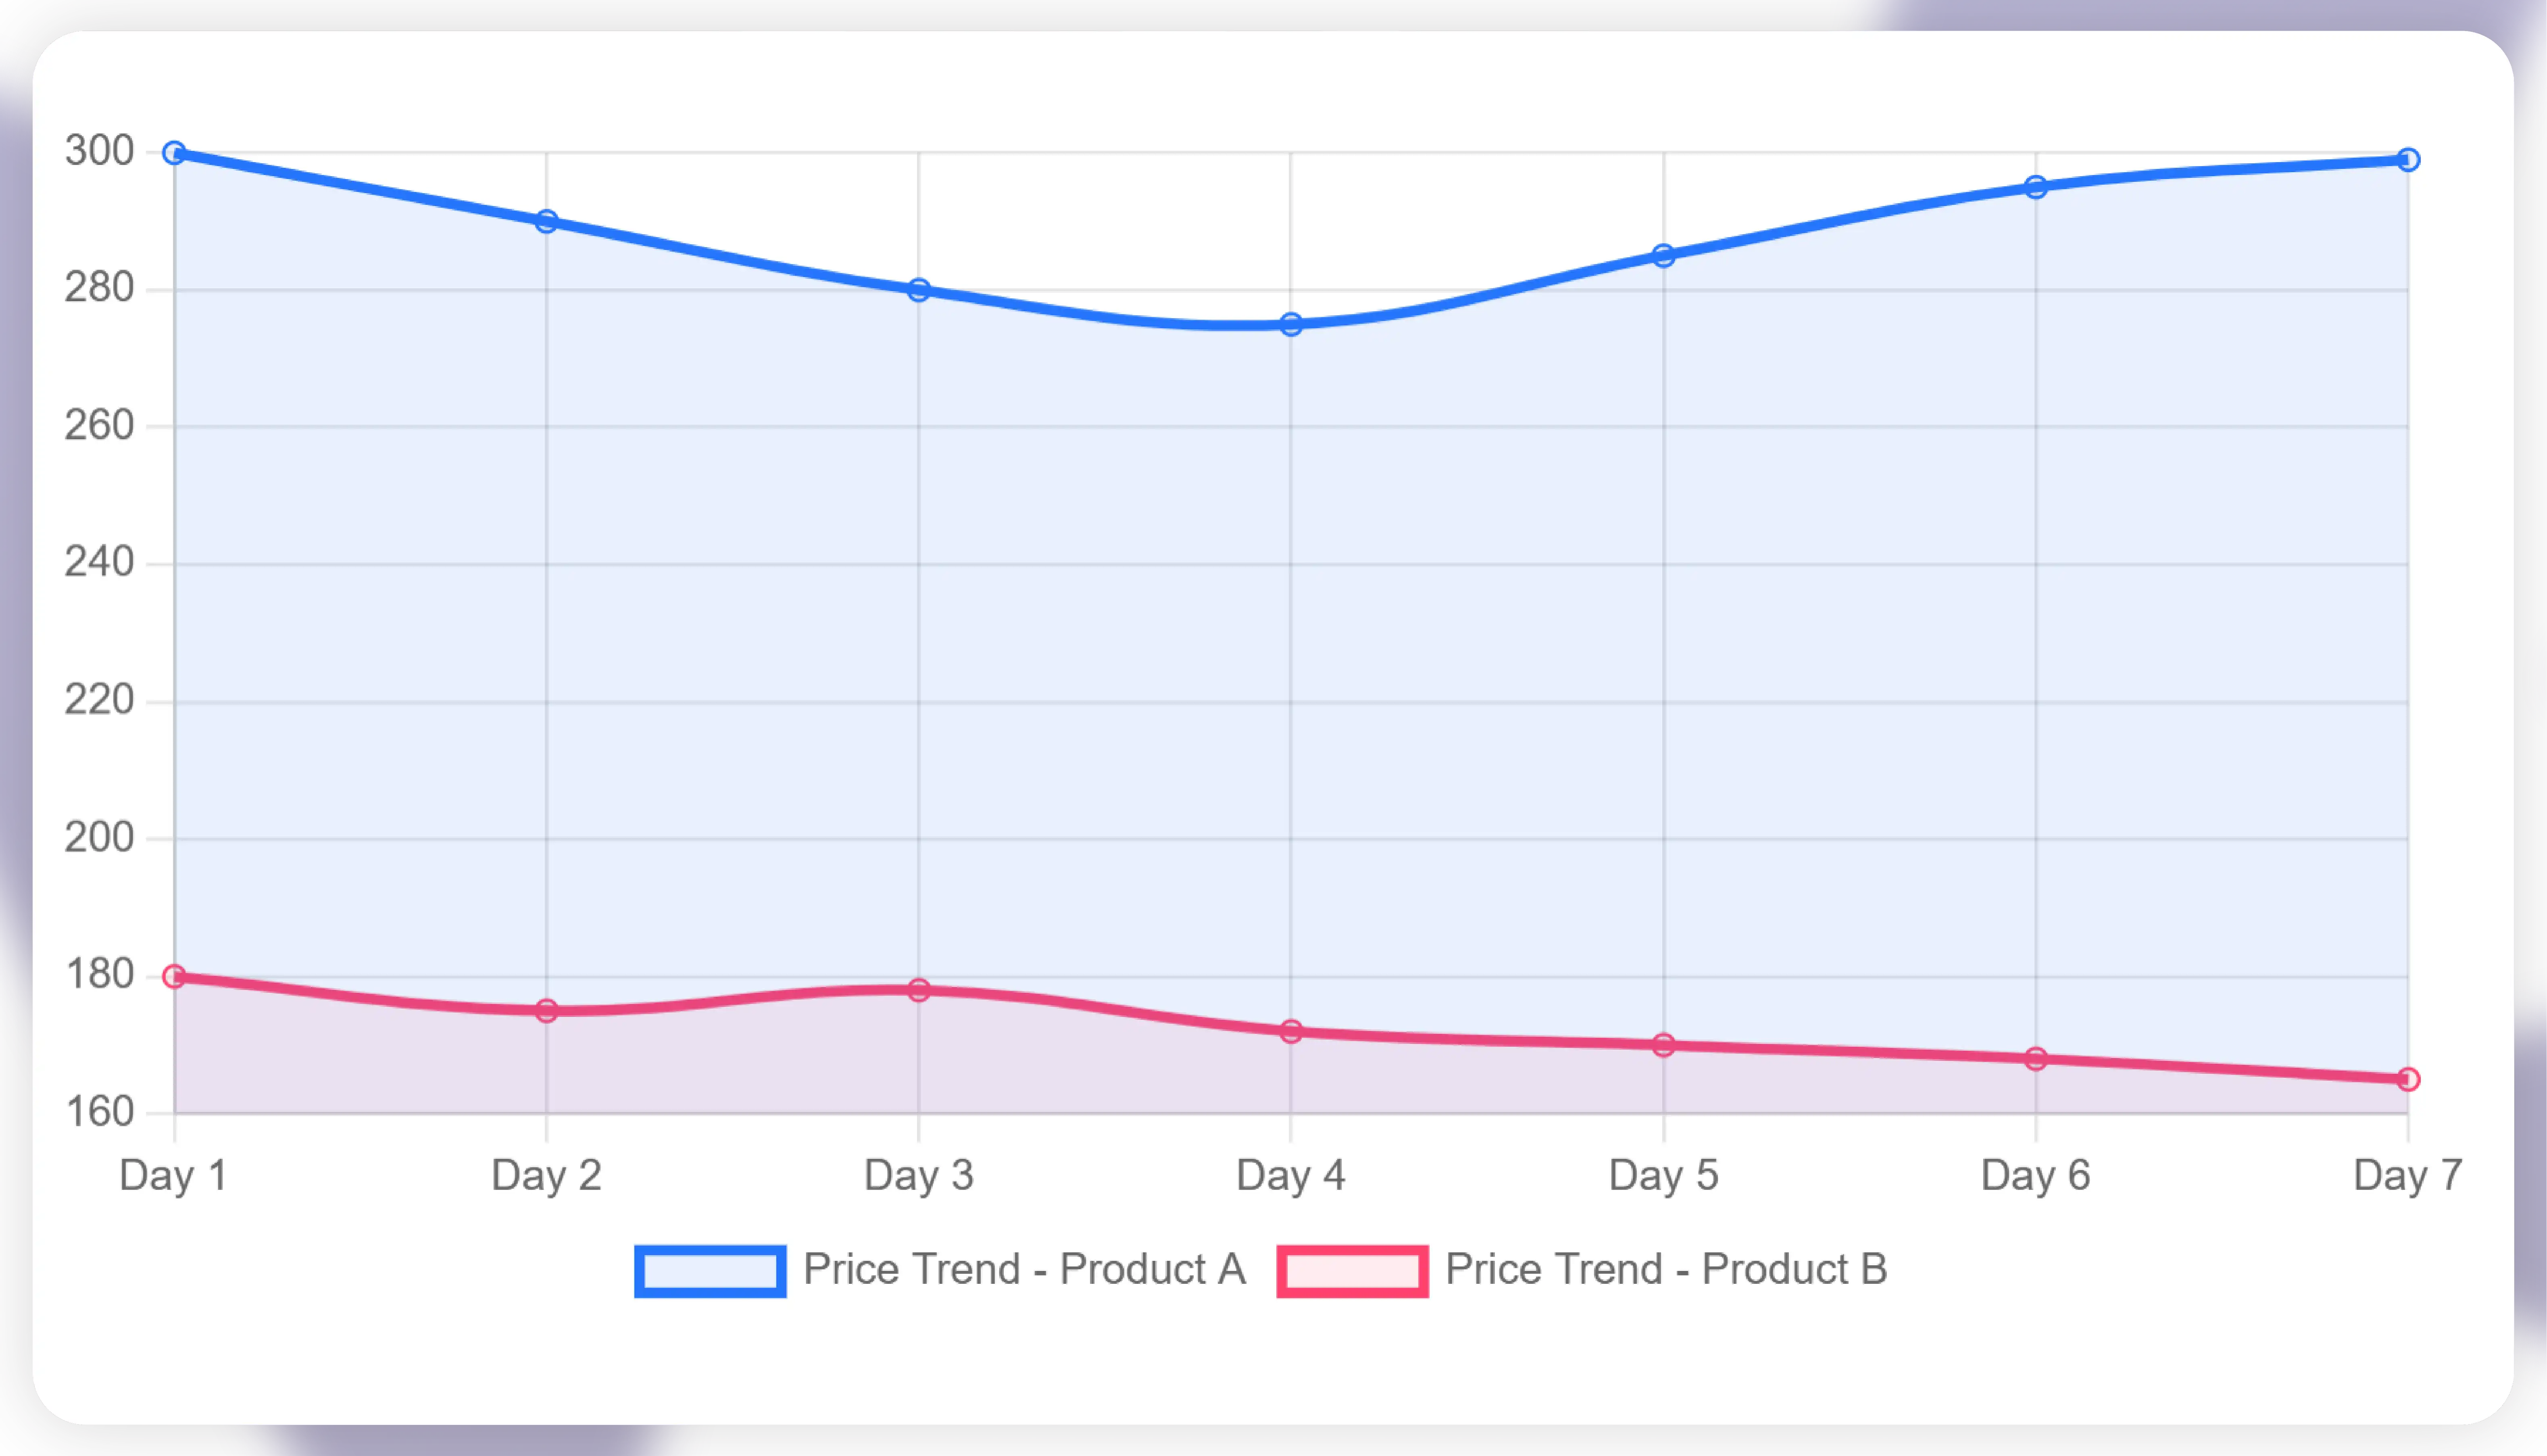
Client : Mid-size electronics retailer in California
Goal : Monitor Amazon, Best Buy, and Walmart prices for top-selling products
Solution by Actowiz Metrics:
Scraping frequency : Every 30 minutes
Dashboard tool : Power BI
API connection : Real-time updates with 10-minute refresh
Sample Data Table:
| Product Name | Amazon Price | Best Buy Price | Walmart Price | Stock Status | Last Updated |
|---|---|---|---|---|---|
| iPhone 14 128GB | $799 | $779 | $785 | In Stock | 2025-08-14 10:30 AM |
| Galaxy S23 256GB | $999 | $979 | $985 | In Stock | 2025-08-14 10:30 AM |
| Sony WH-1000XM5 | $349 | $339 | $345 | Low Stock | 2025-08-14 10:30 AM |
Impact:
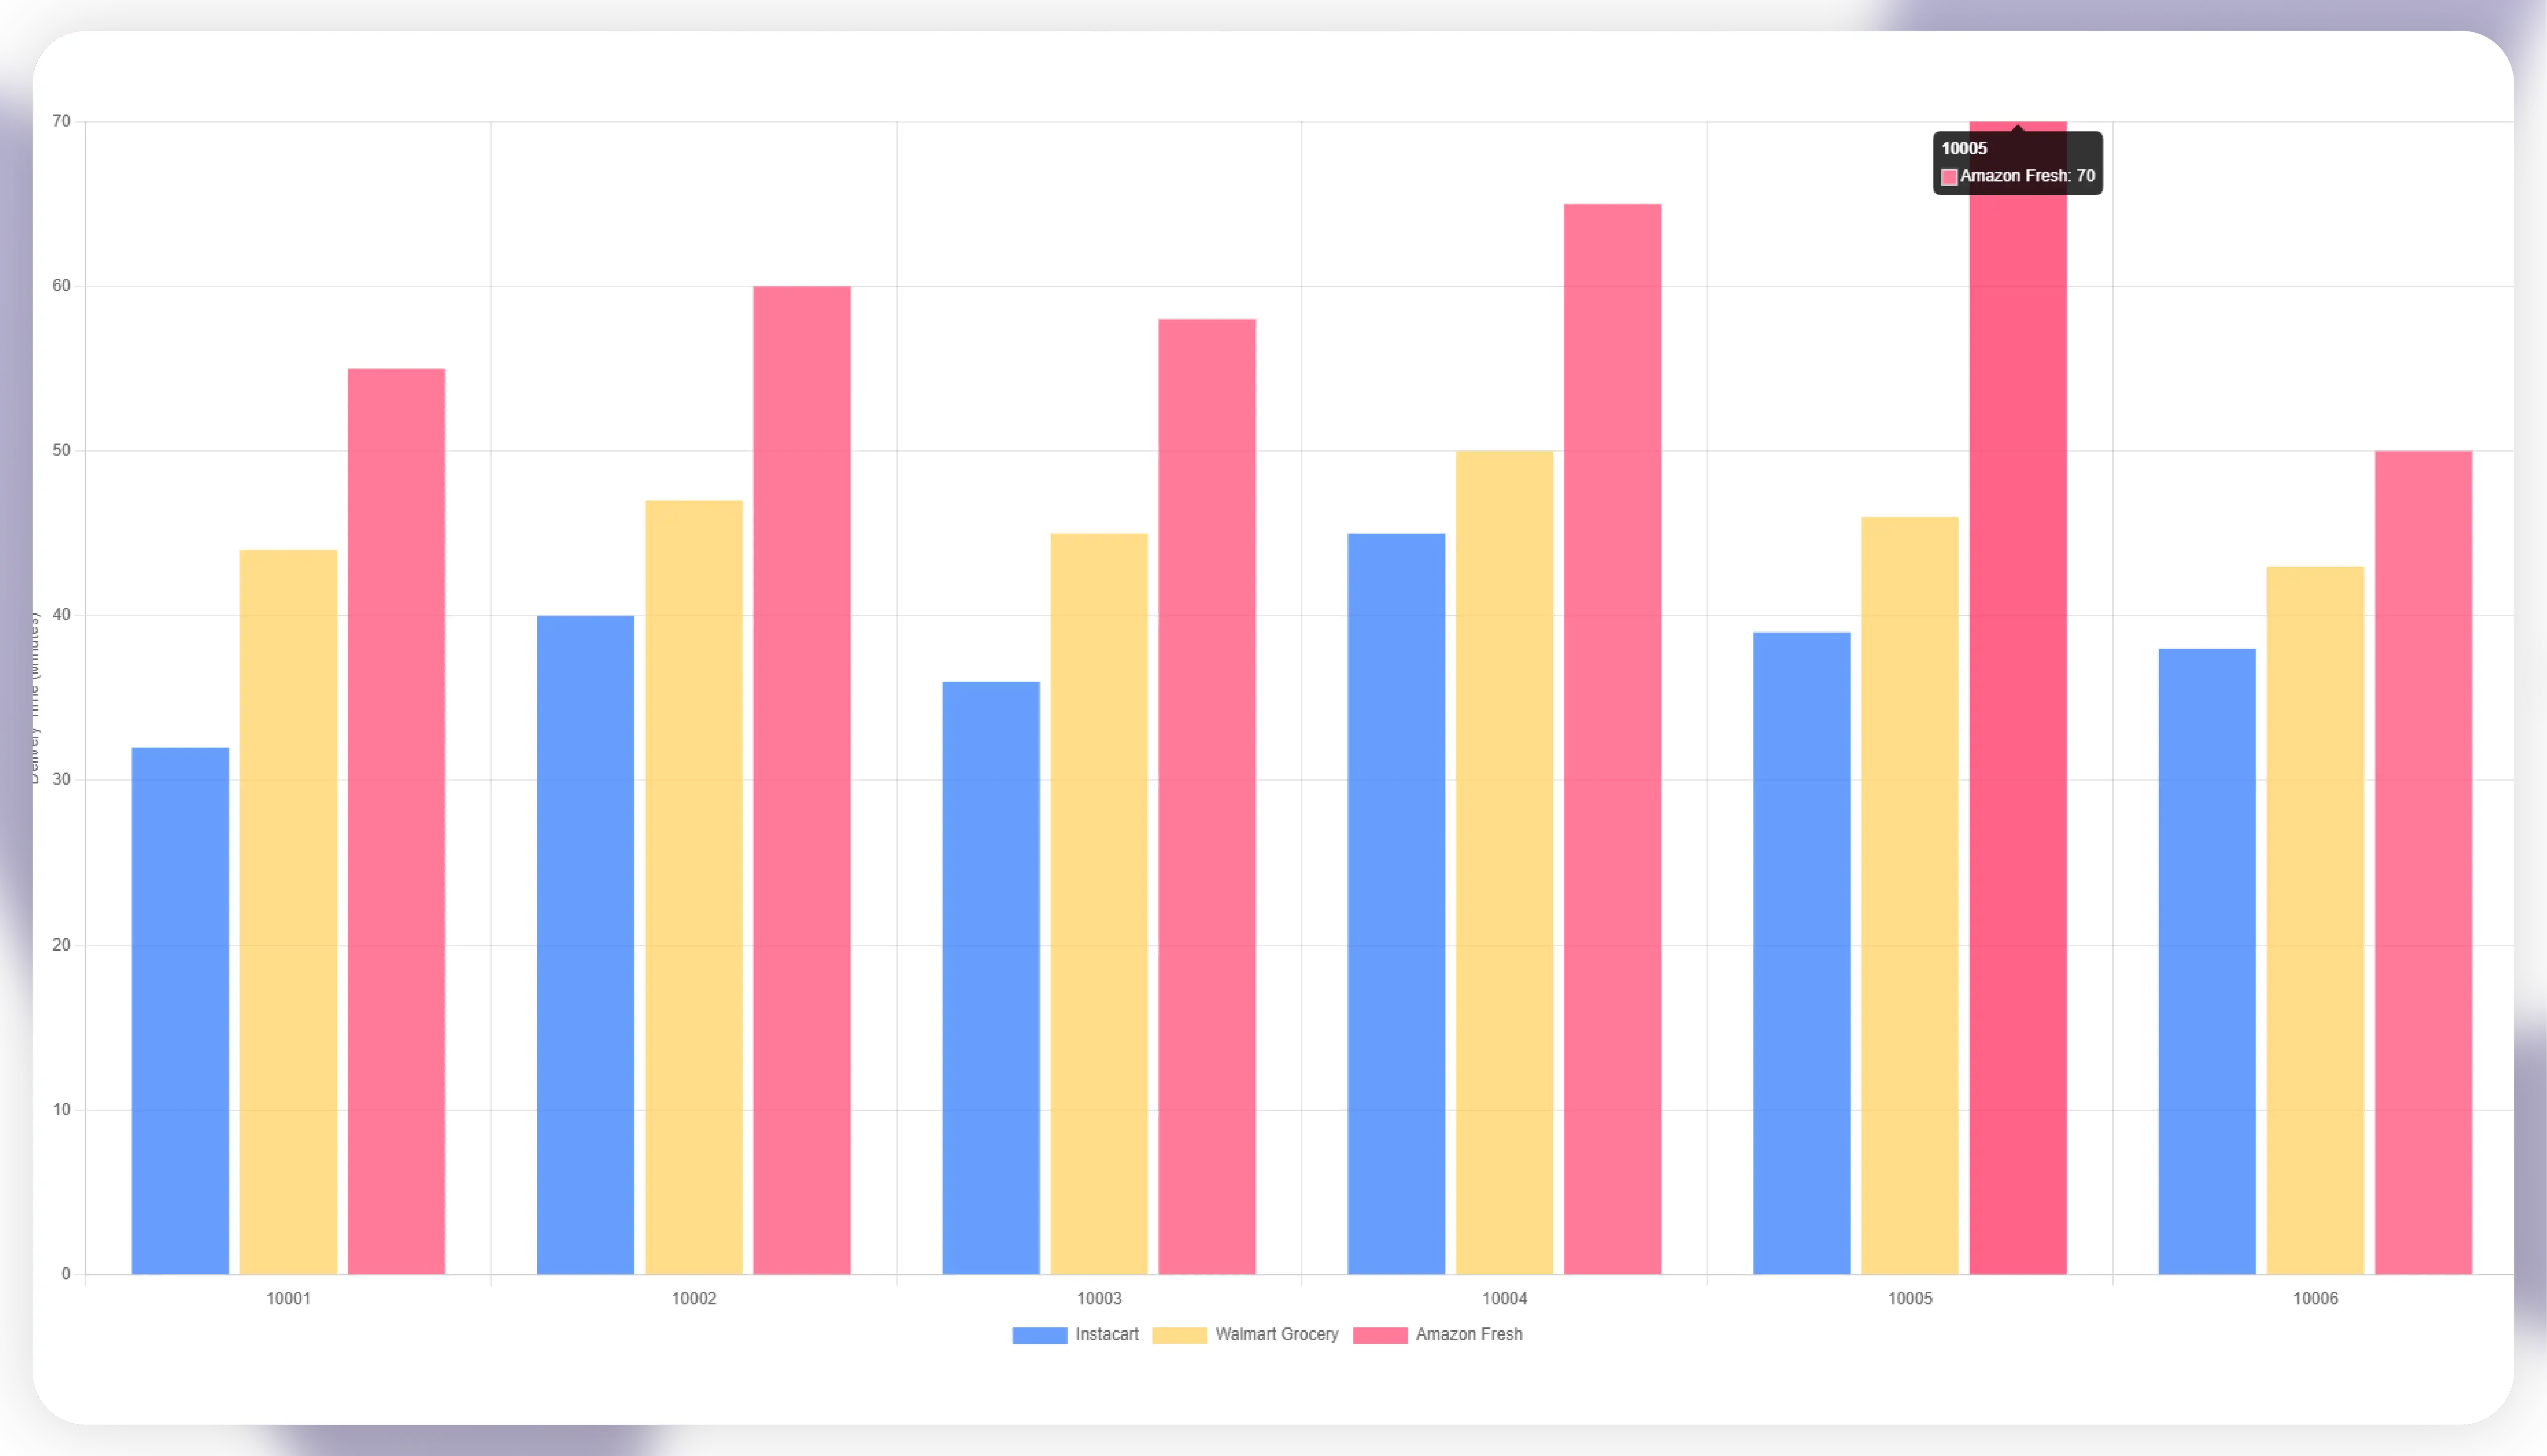
Client : New York-based grocery startup
Goal : Compare delivery times for Instacart, Walmart Grocery, and Amazon Fresh by ZIP code
Solution:
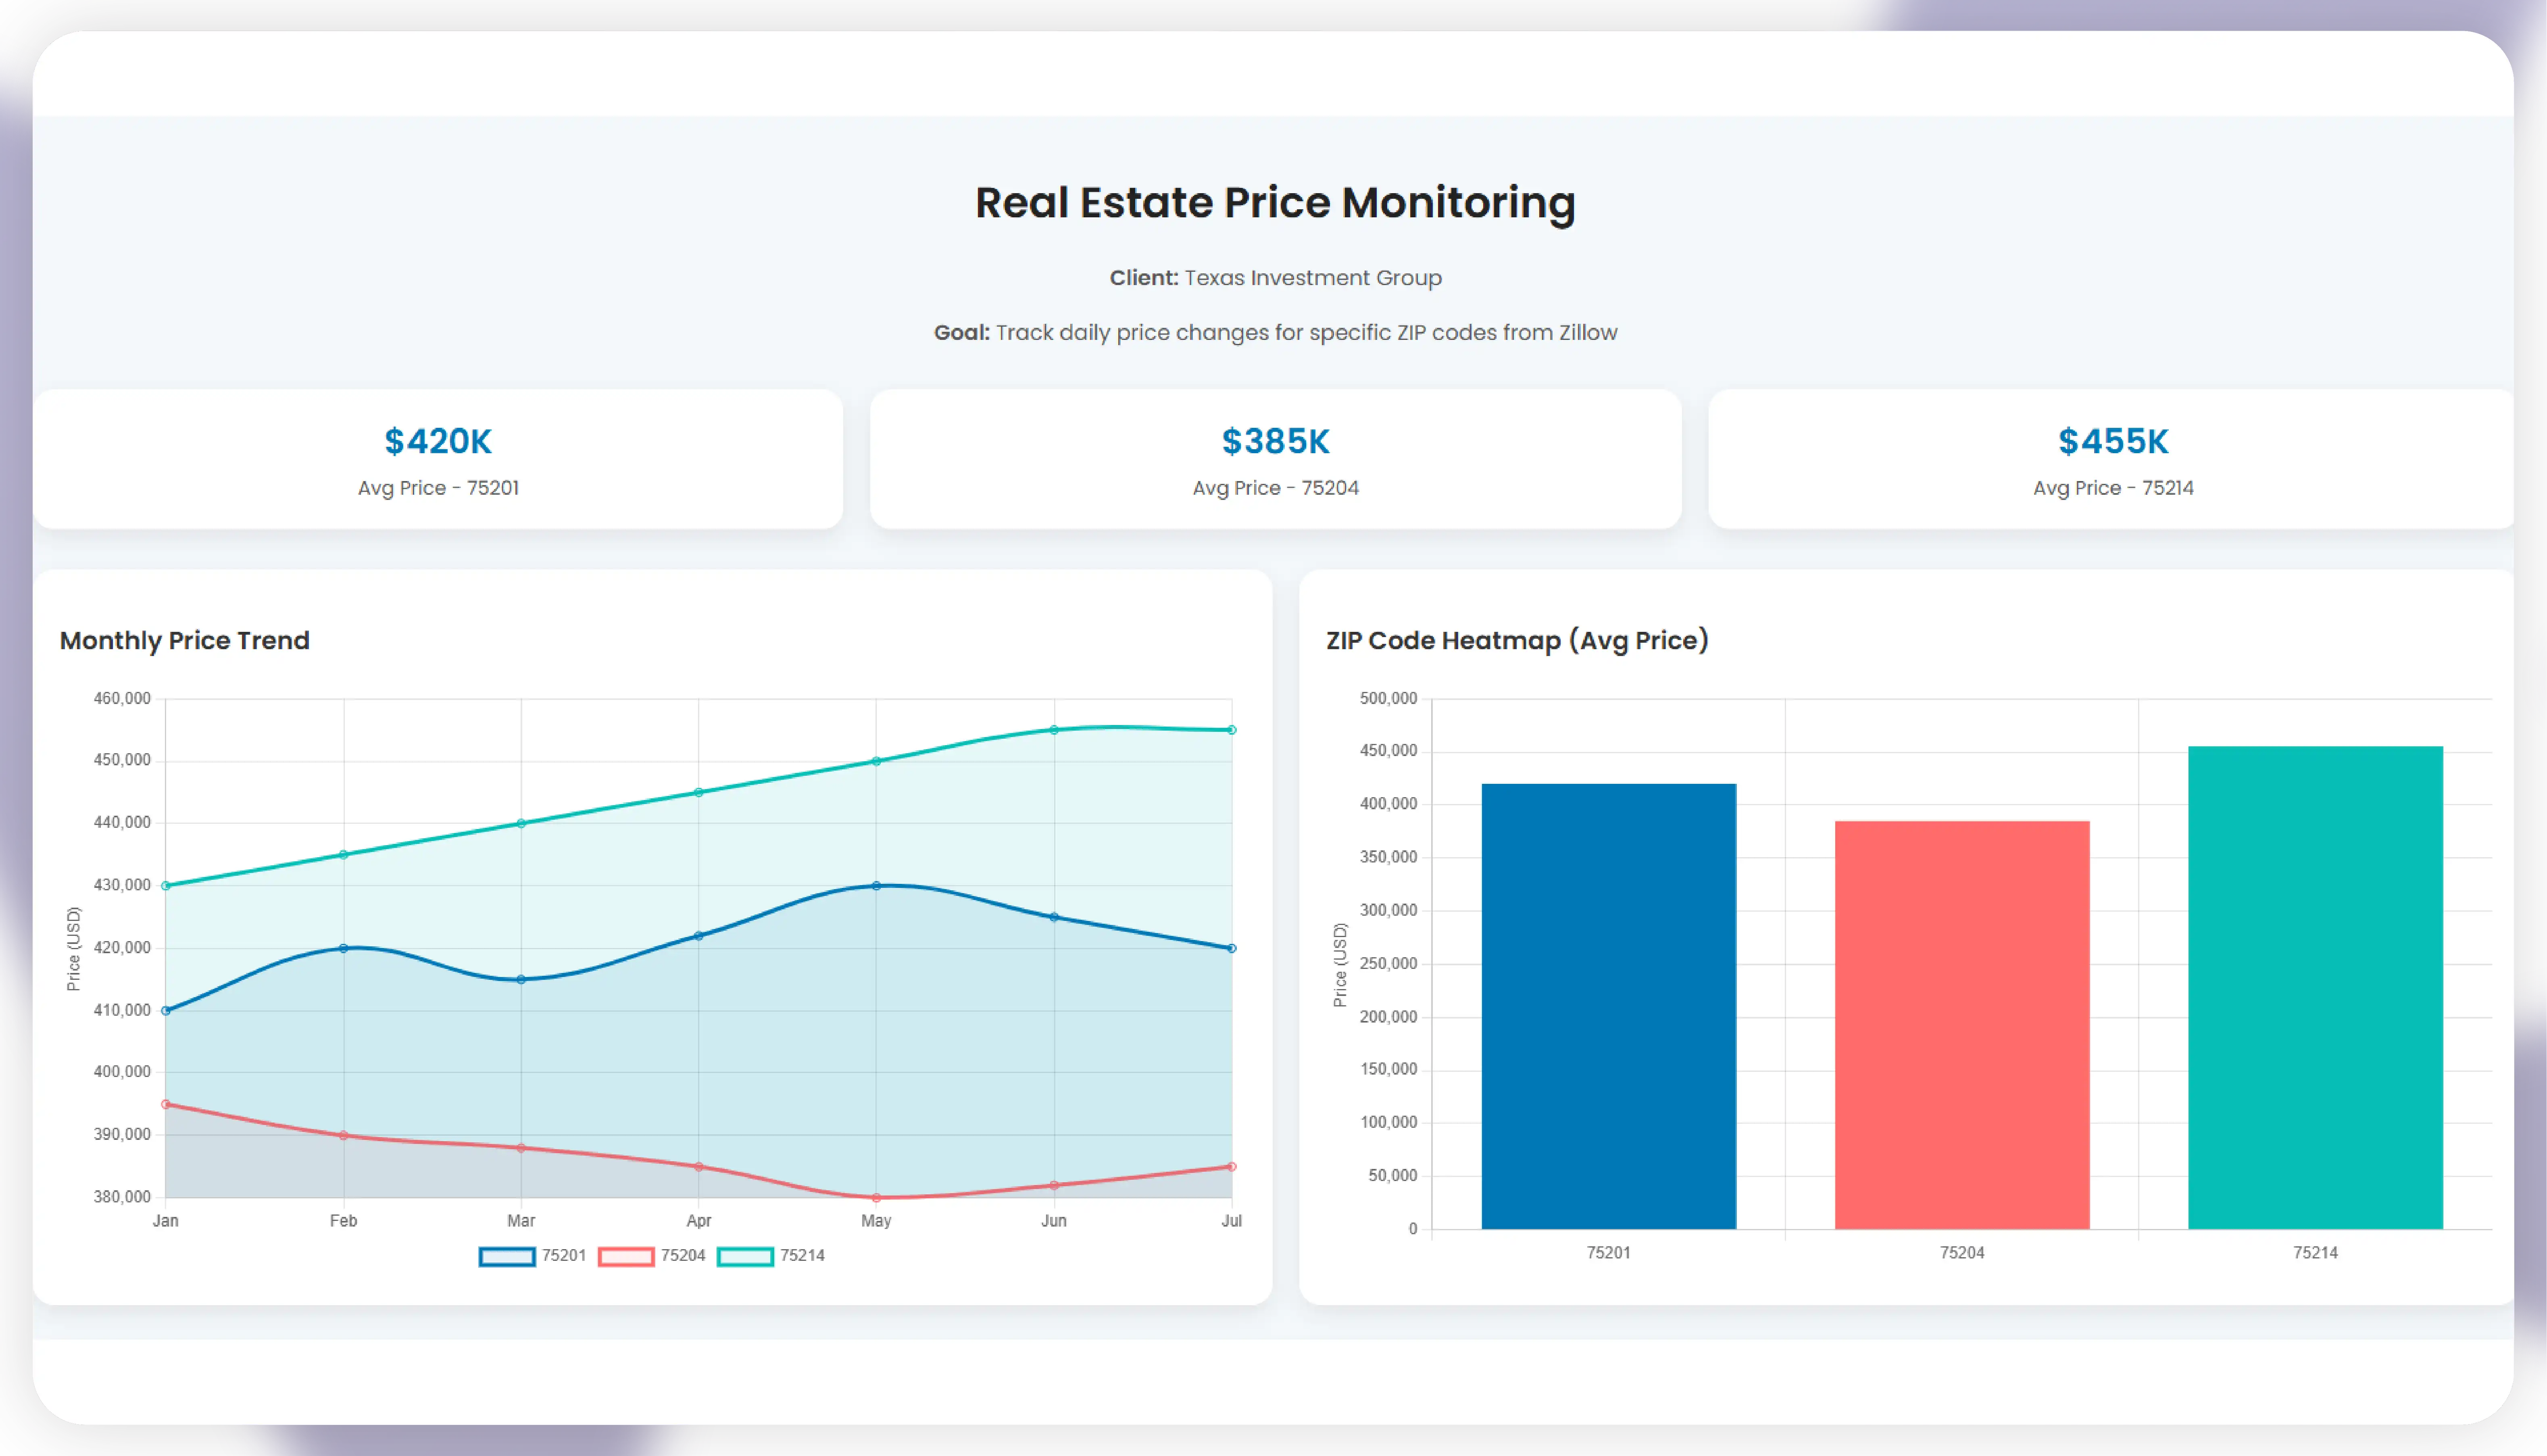
Client : Texas investment group
Goal : Track daily price changes for specific ZIP codes from Zillow
Solution:
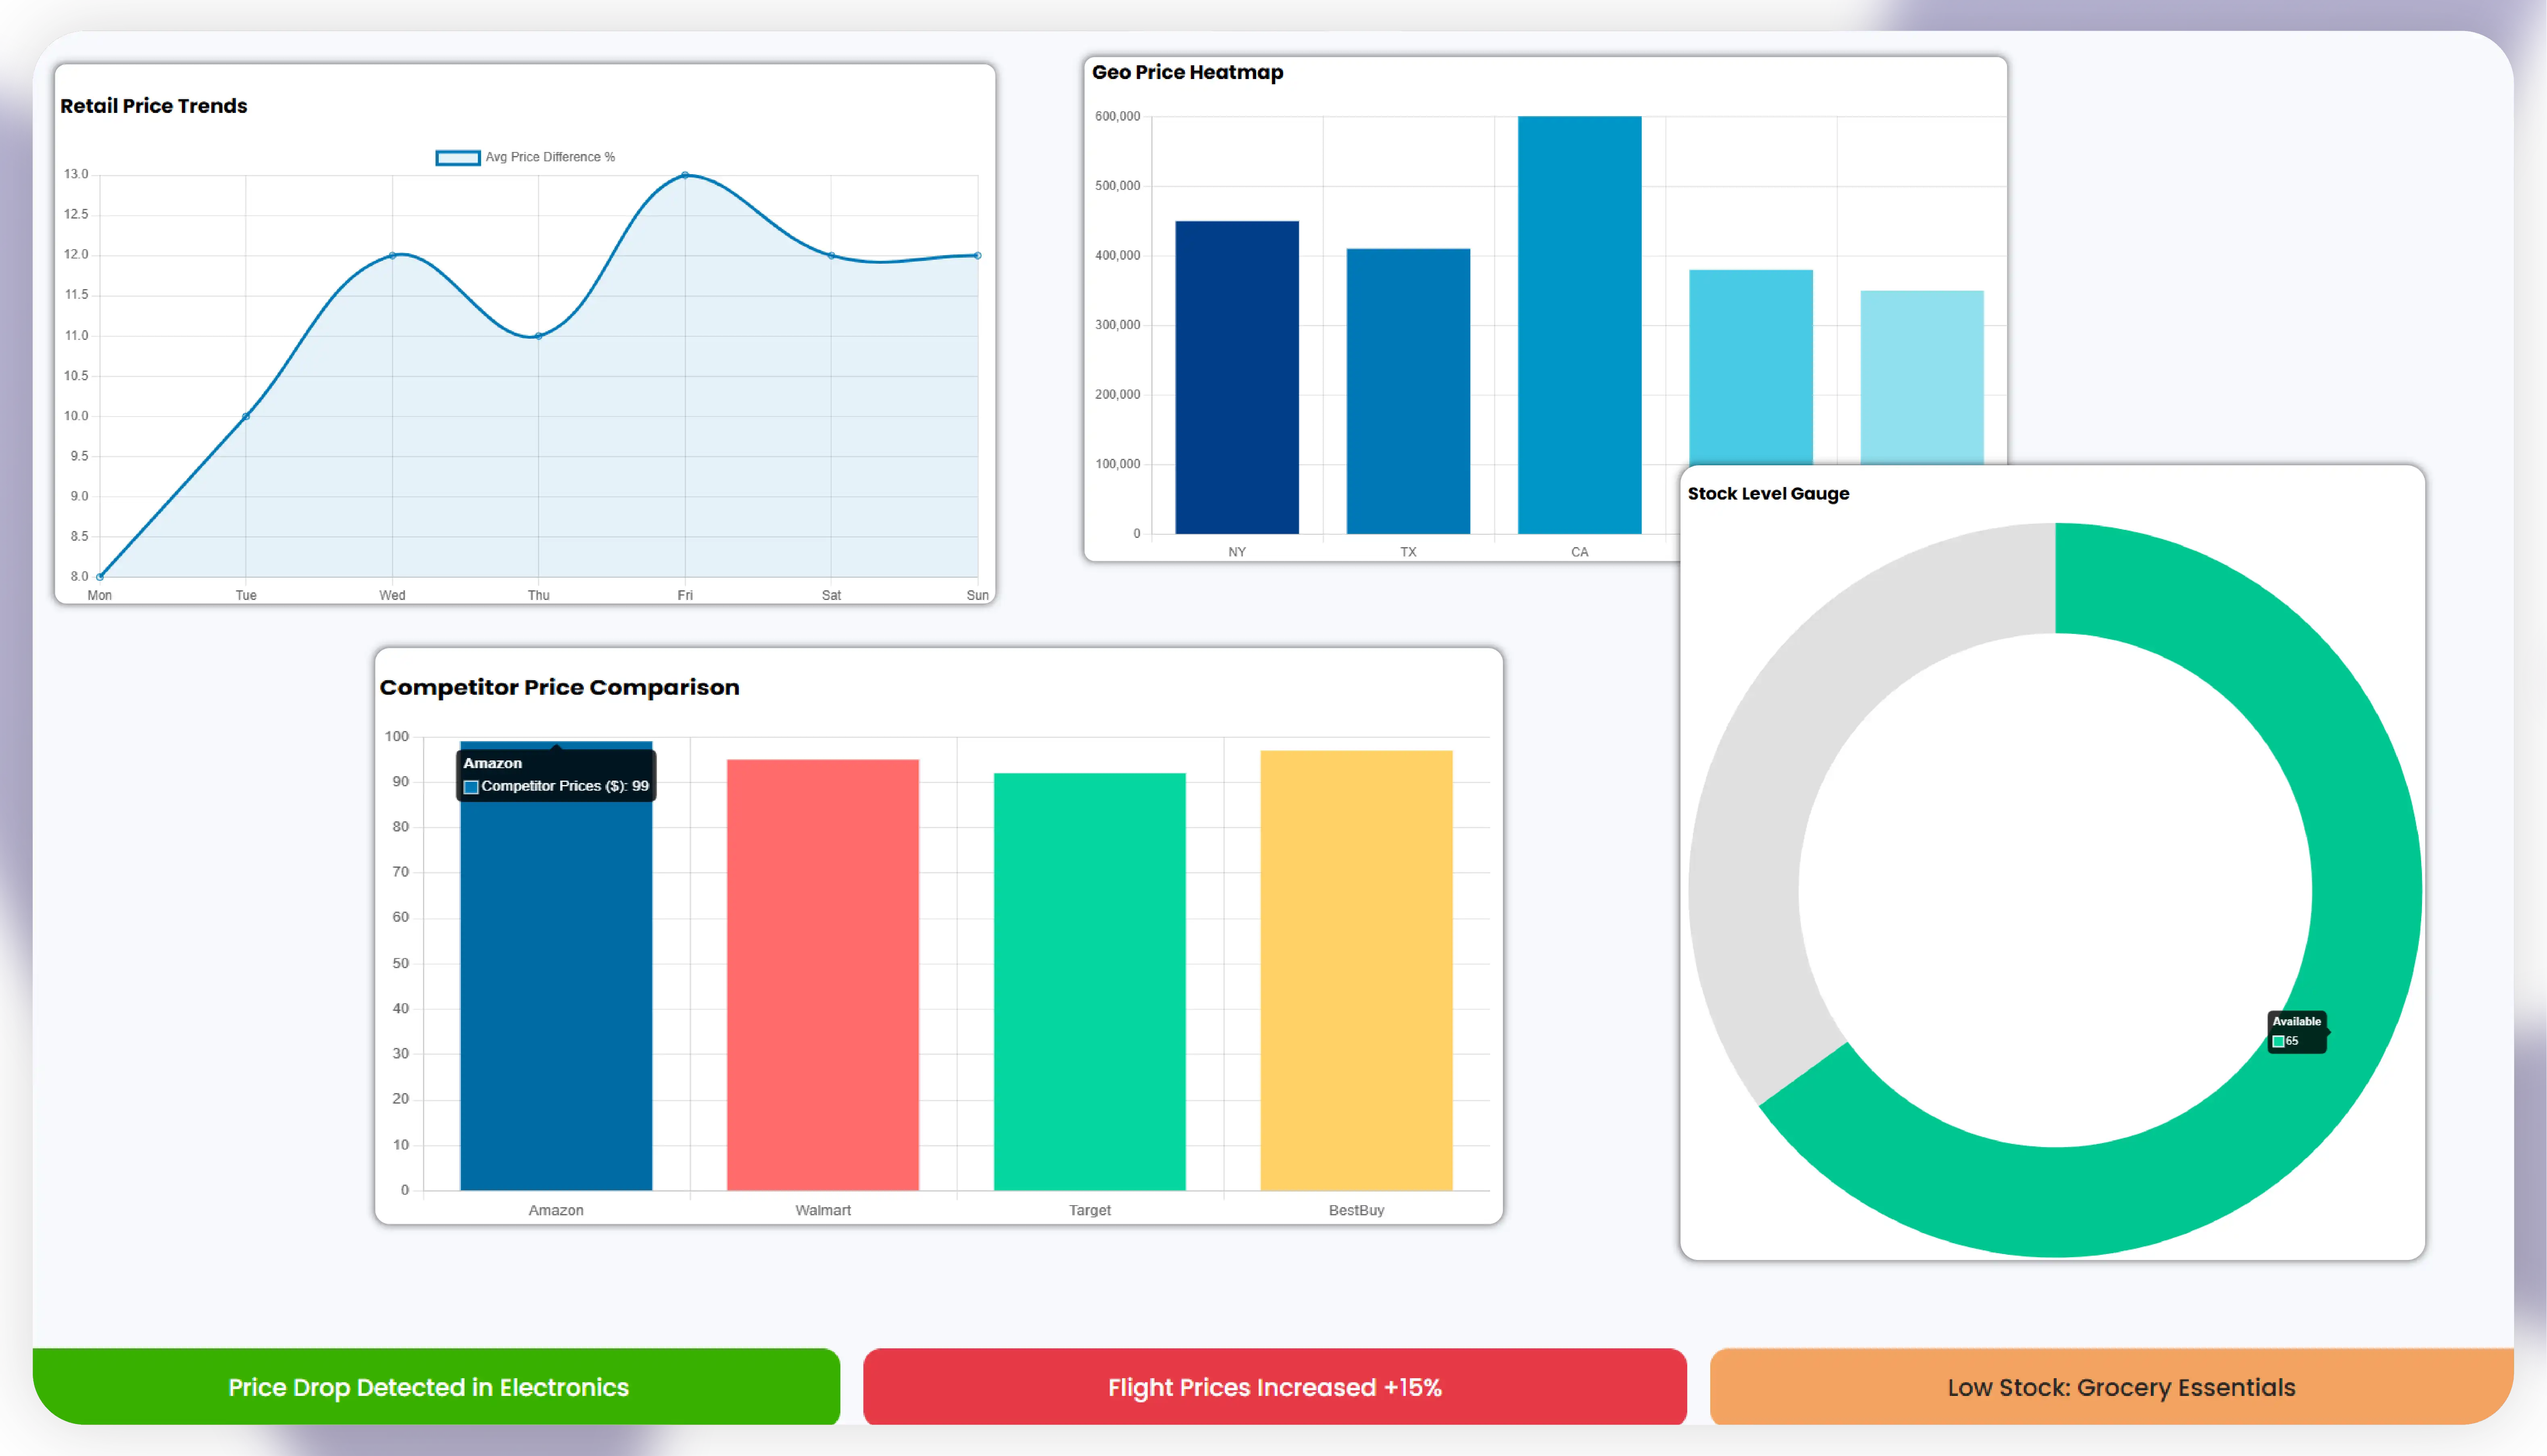
Retail : Price difference %, competitor lowest price, stock availability
Travel : Average ticket price, price volatility, booking availability
Real estate : Median price, days on market, price per sq ft
Line charts : Show trends over time
Bar charts : Compare competitor prices
Heatmaps : Show geographic price distribution
Gauge charts : Show stock levels or delivery performance
Green : Price drop
Red : Price increase
Yellow : Low stock
Many executives check dashboards from smartphones — ensure responsive layouts.
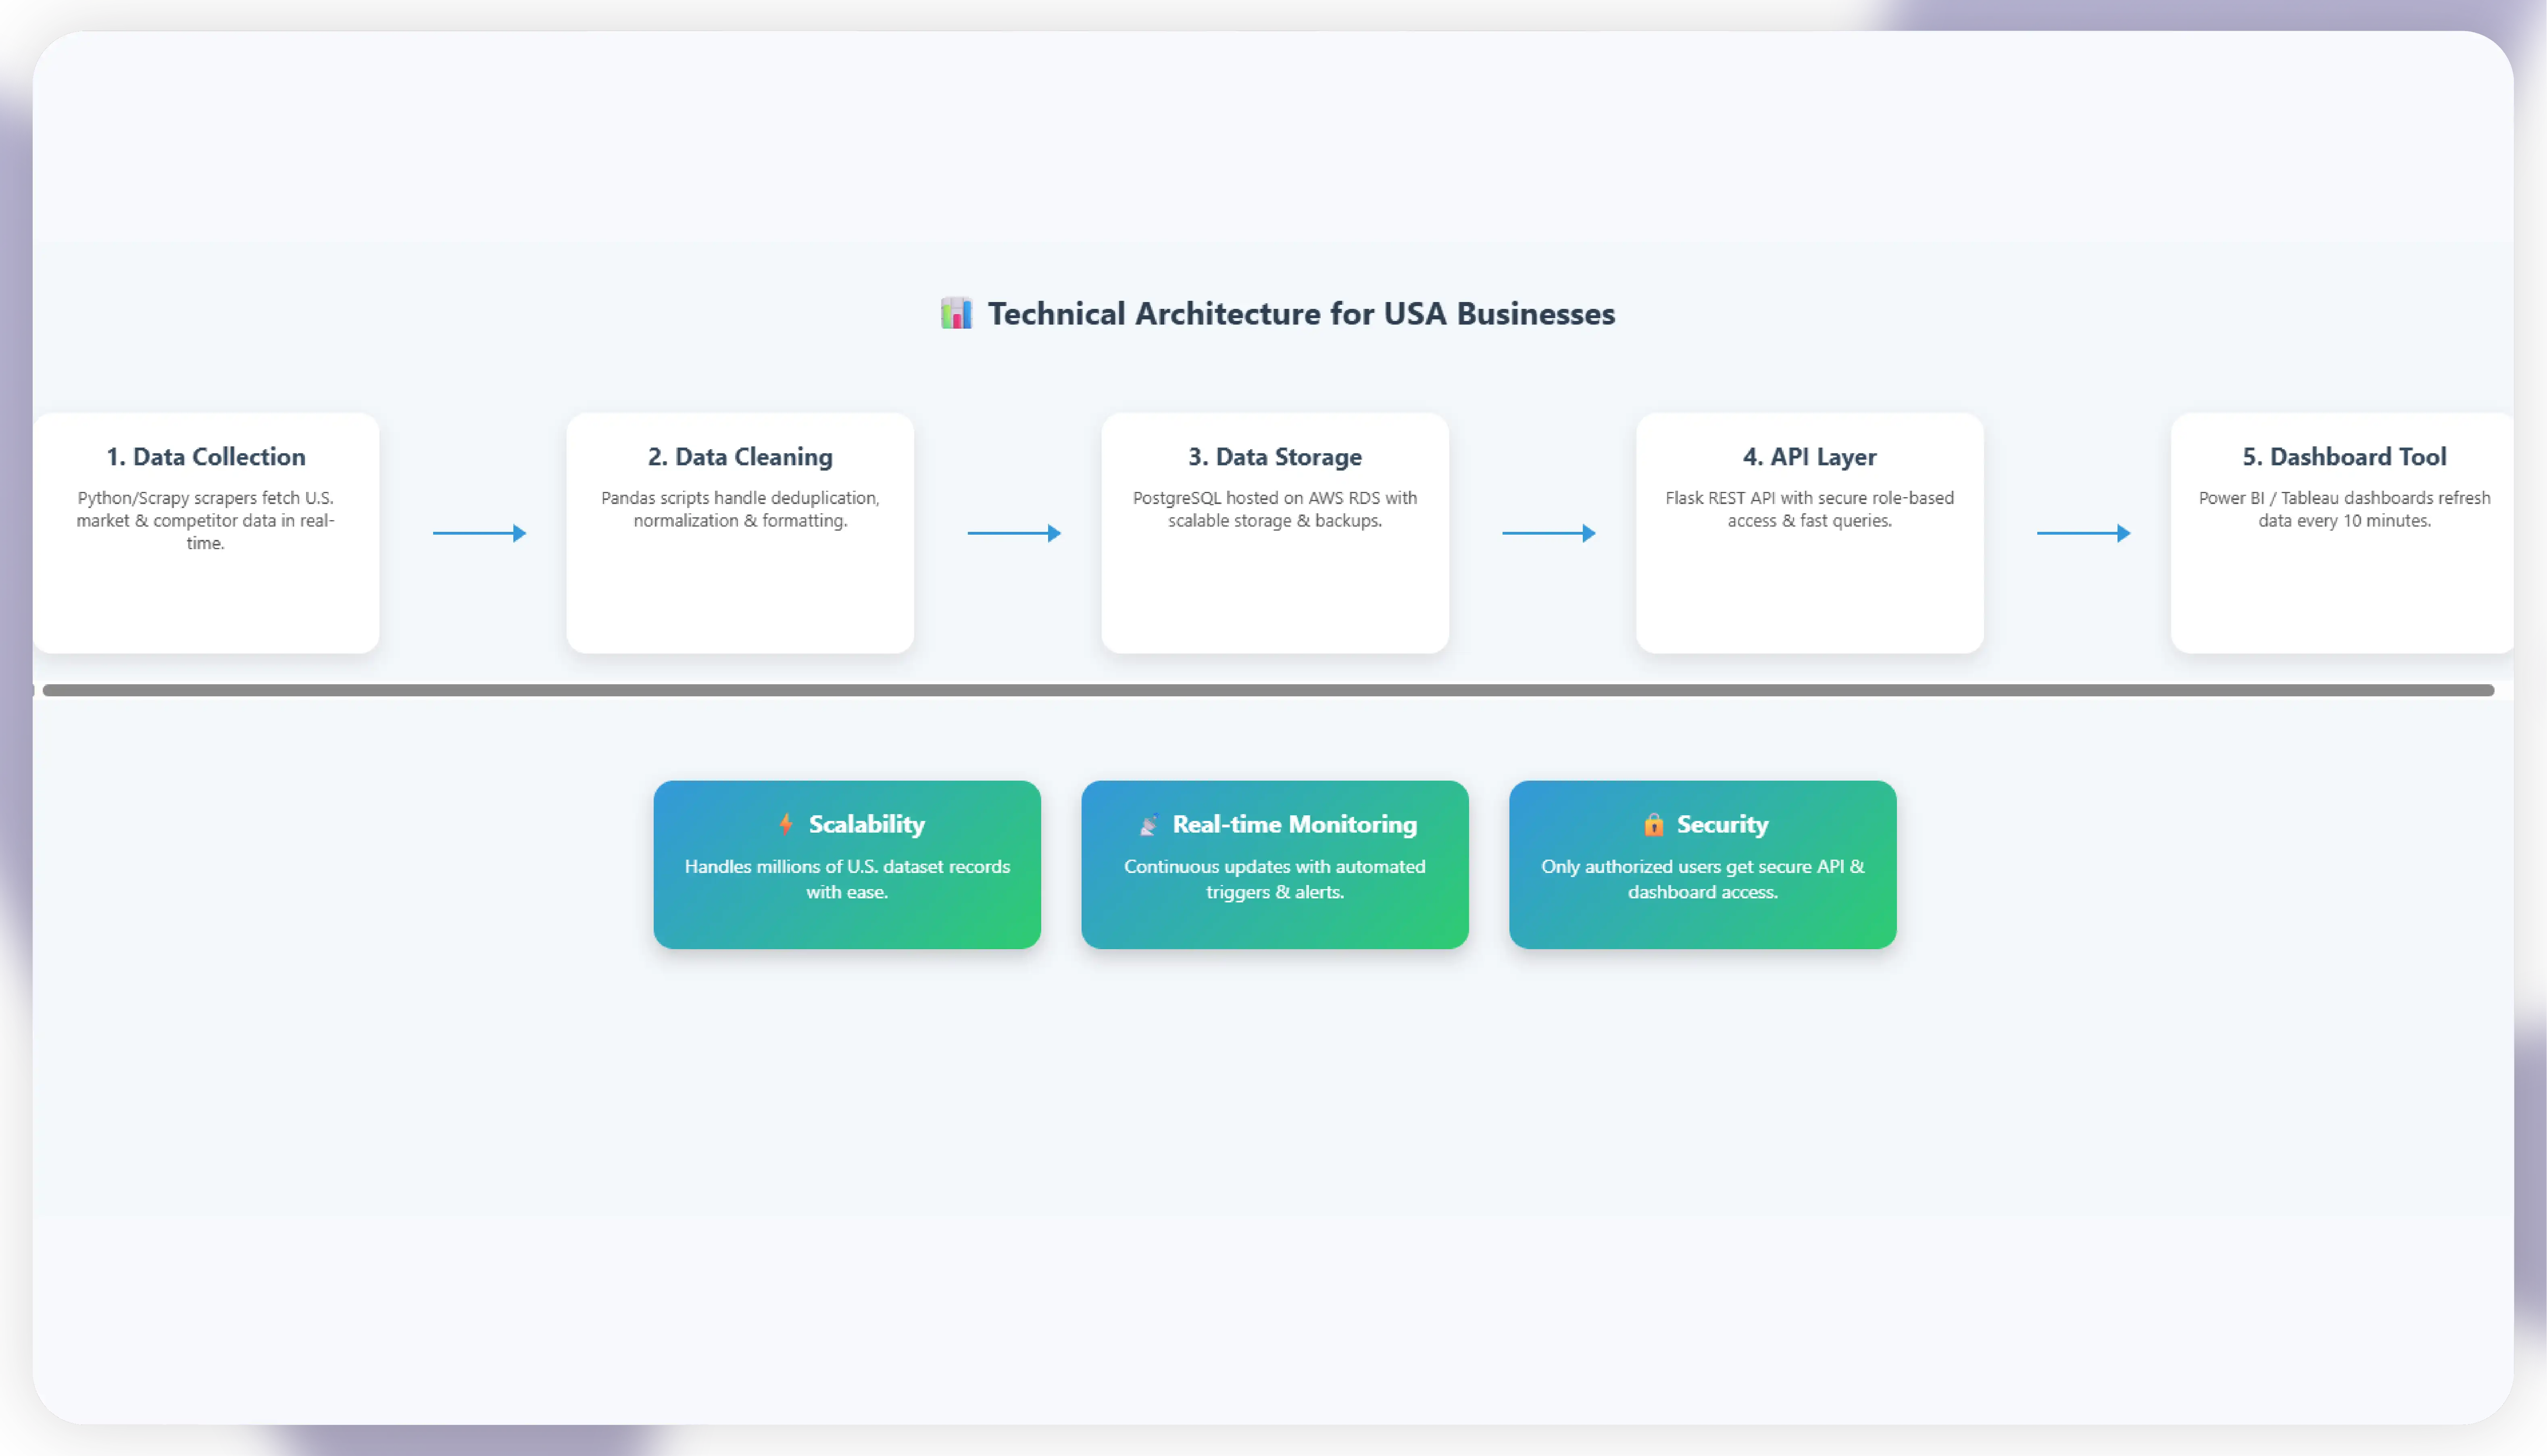
Workflow:
1. Data Collection : Scrapers (Python/Scrapy)
2. Data Cleaning : Pandas scripts
3. Data Storage : PostgreSQL on AWS RDS
4. API Layer : Flask-based REST API
5. Dashboard Tool : Power BI/Tableau
Benefits:
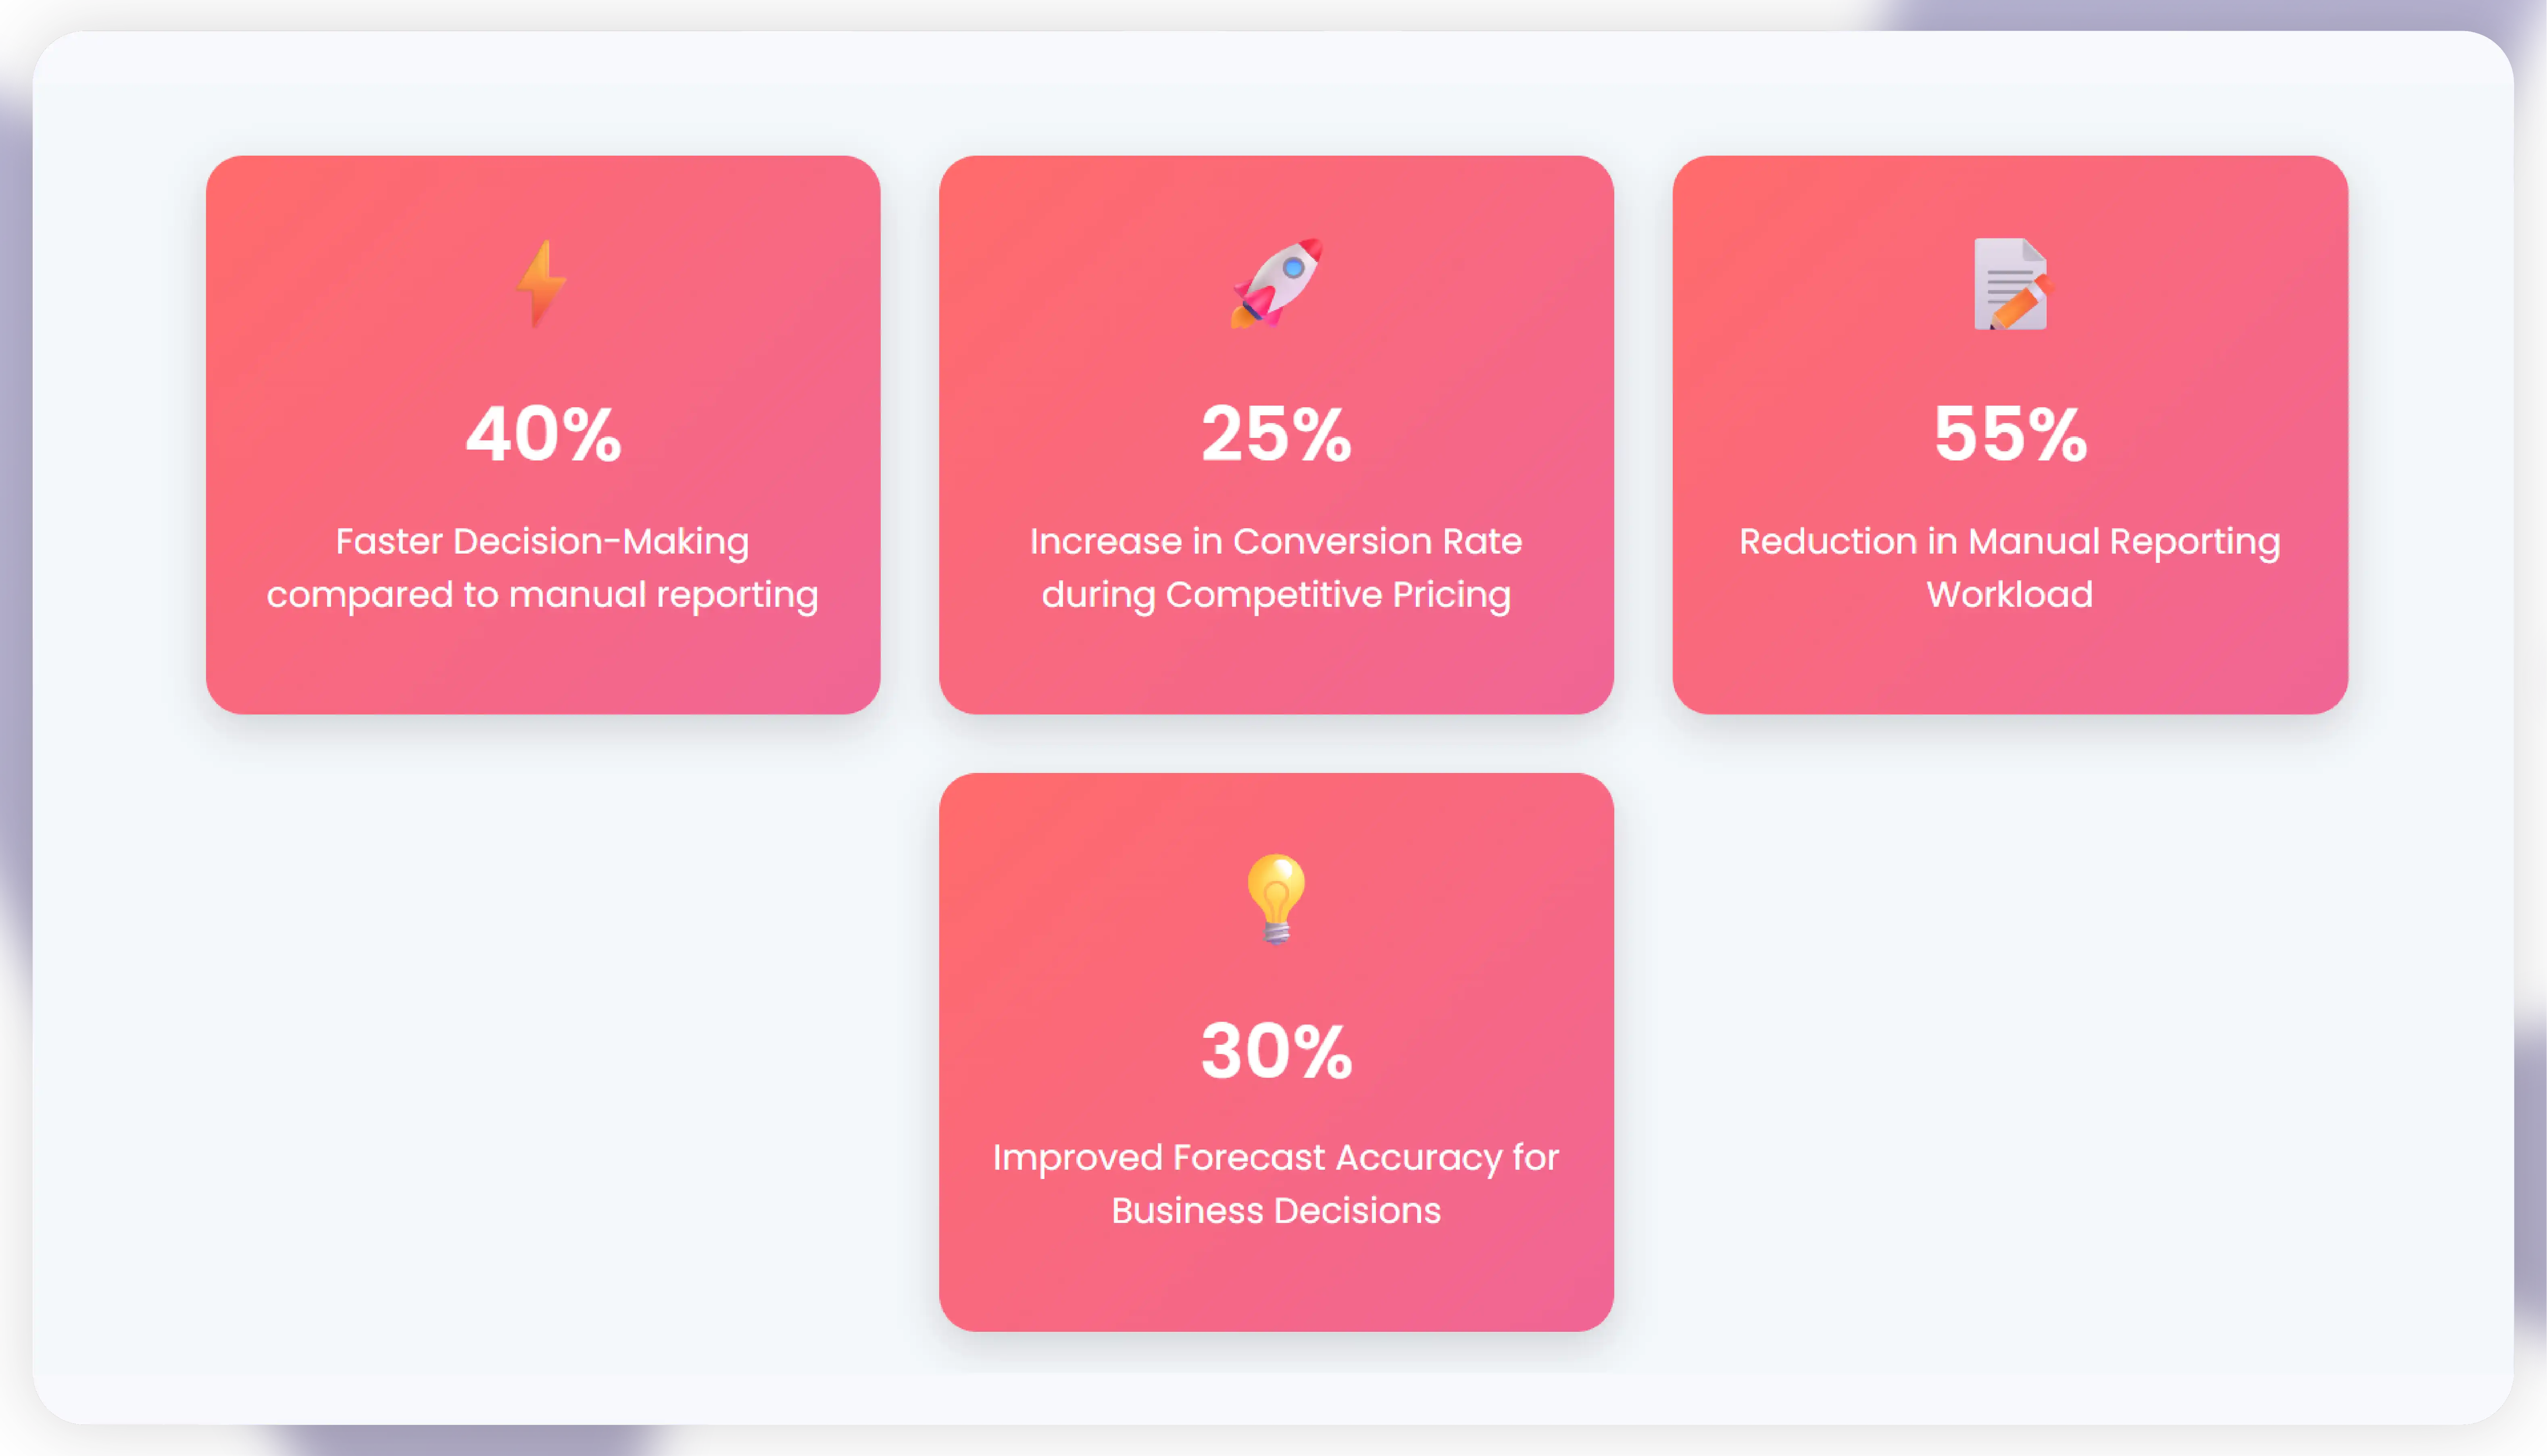
USA businesses using Actowiz Metrics reported:
In today’s data-driven economy, scraping data dashboards are not optional — they’re a competitive necessity. With real-time scraped data dashboards, interactive competitor monitoring, and API data visualization, Actowiz Metrics enables USA companies to stay ahead, make faster decisions, and optimize strategies based on accurate, up-to-the-minute information.
Expert blogs, research reports and infographics — practical, data-driven reading across e-commerce and quick-commerce.
Most fields are optional — the more you share, the better your sample.


.webp "infographics")
.webp "infographics")


