BLOG




















On quick-commerce apps, an out-of-stock product is invisible. It drops down search results, disappears from collections, and the shopper buys a competitor's product instead, often in seconds. For FMCG brands, on-shelf availability in dark stores has become one of the most important drivers of quick-commerce sales.
In 2026 Actowiz Metrics received many availability requests: a brand needing "daily dark store availability data," a client wanting pincode-wise stock on Zepto and Instamart, another asking for real-time stock for many items across Flipkart Minutes stores, and an investment firm interested in digital shelf analytics across quick commerce. This report uses Dark Store Availability Data Scraping to measure in-stock rates for top FMCG SKUs across six Indian metros.
Key illustrative findings:
Six metros: Mumbai, Delhi NCR, Bengaluru, Hyderabad, Pune and Chennai. In each city, 50 pincodes were selected to represent different dark stores and neighbourhood types, for 300 pincodes in total.
Blinkit, Zepto and Swiggy Instamart, with Flipkart Minutes and BigBasket's quick-delivery service tracked in a subset of pincodes.
The top 400 FMCG SKUs across eight categories, selected by search rank and bestseller presence:
| Category | SKUs |
|---|---|
| Dairy and eggs | 60 |
| Bakery | 30 |
| Snacks | 70 |
| Beverages | 60 |
| Staples (atta, rice, dal, oil) | 50 |
| Personal care | 50 |
| Home care | 50 |
| Baby care | 30 |
Dark store availability data scraping checked each SKU in each pincode on each platform at three time slots (8 am, 1 pm and 8 pm) daily for four weeks. Each check recorded listed or not listed, in stock or out of stock, low-stock messages, price and delivery promise.
| Platform | In-stock rate | Listing rate | Effective availability |
|---|---|---|---|
| Platform A | 89% | 94% | 84% |
| Platform B | 86% | 91% | 78% |
| Platform C | 87% | 92% | 80% |
All values illustrative; platforms anonymised.
Differences between platforms are small on average but larger in specific categories and cities.
| Category | In-stock rate | Evening in-stock rate |
|---|---|---|
| Staples | 93% | 90% |
| Home care | 92% | 90% |
| Personal care | 91% | 89% |
| Snacks | 89% | 84% |
| Beverages | 88% | 81% |
| Baby care | 87% | 84% |
| Bakery | 80% | 69% |
| Dairy and eggs | 79% | 68% |
All values illustrative.
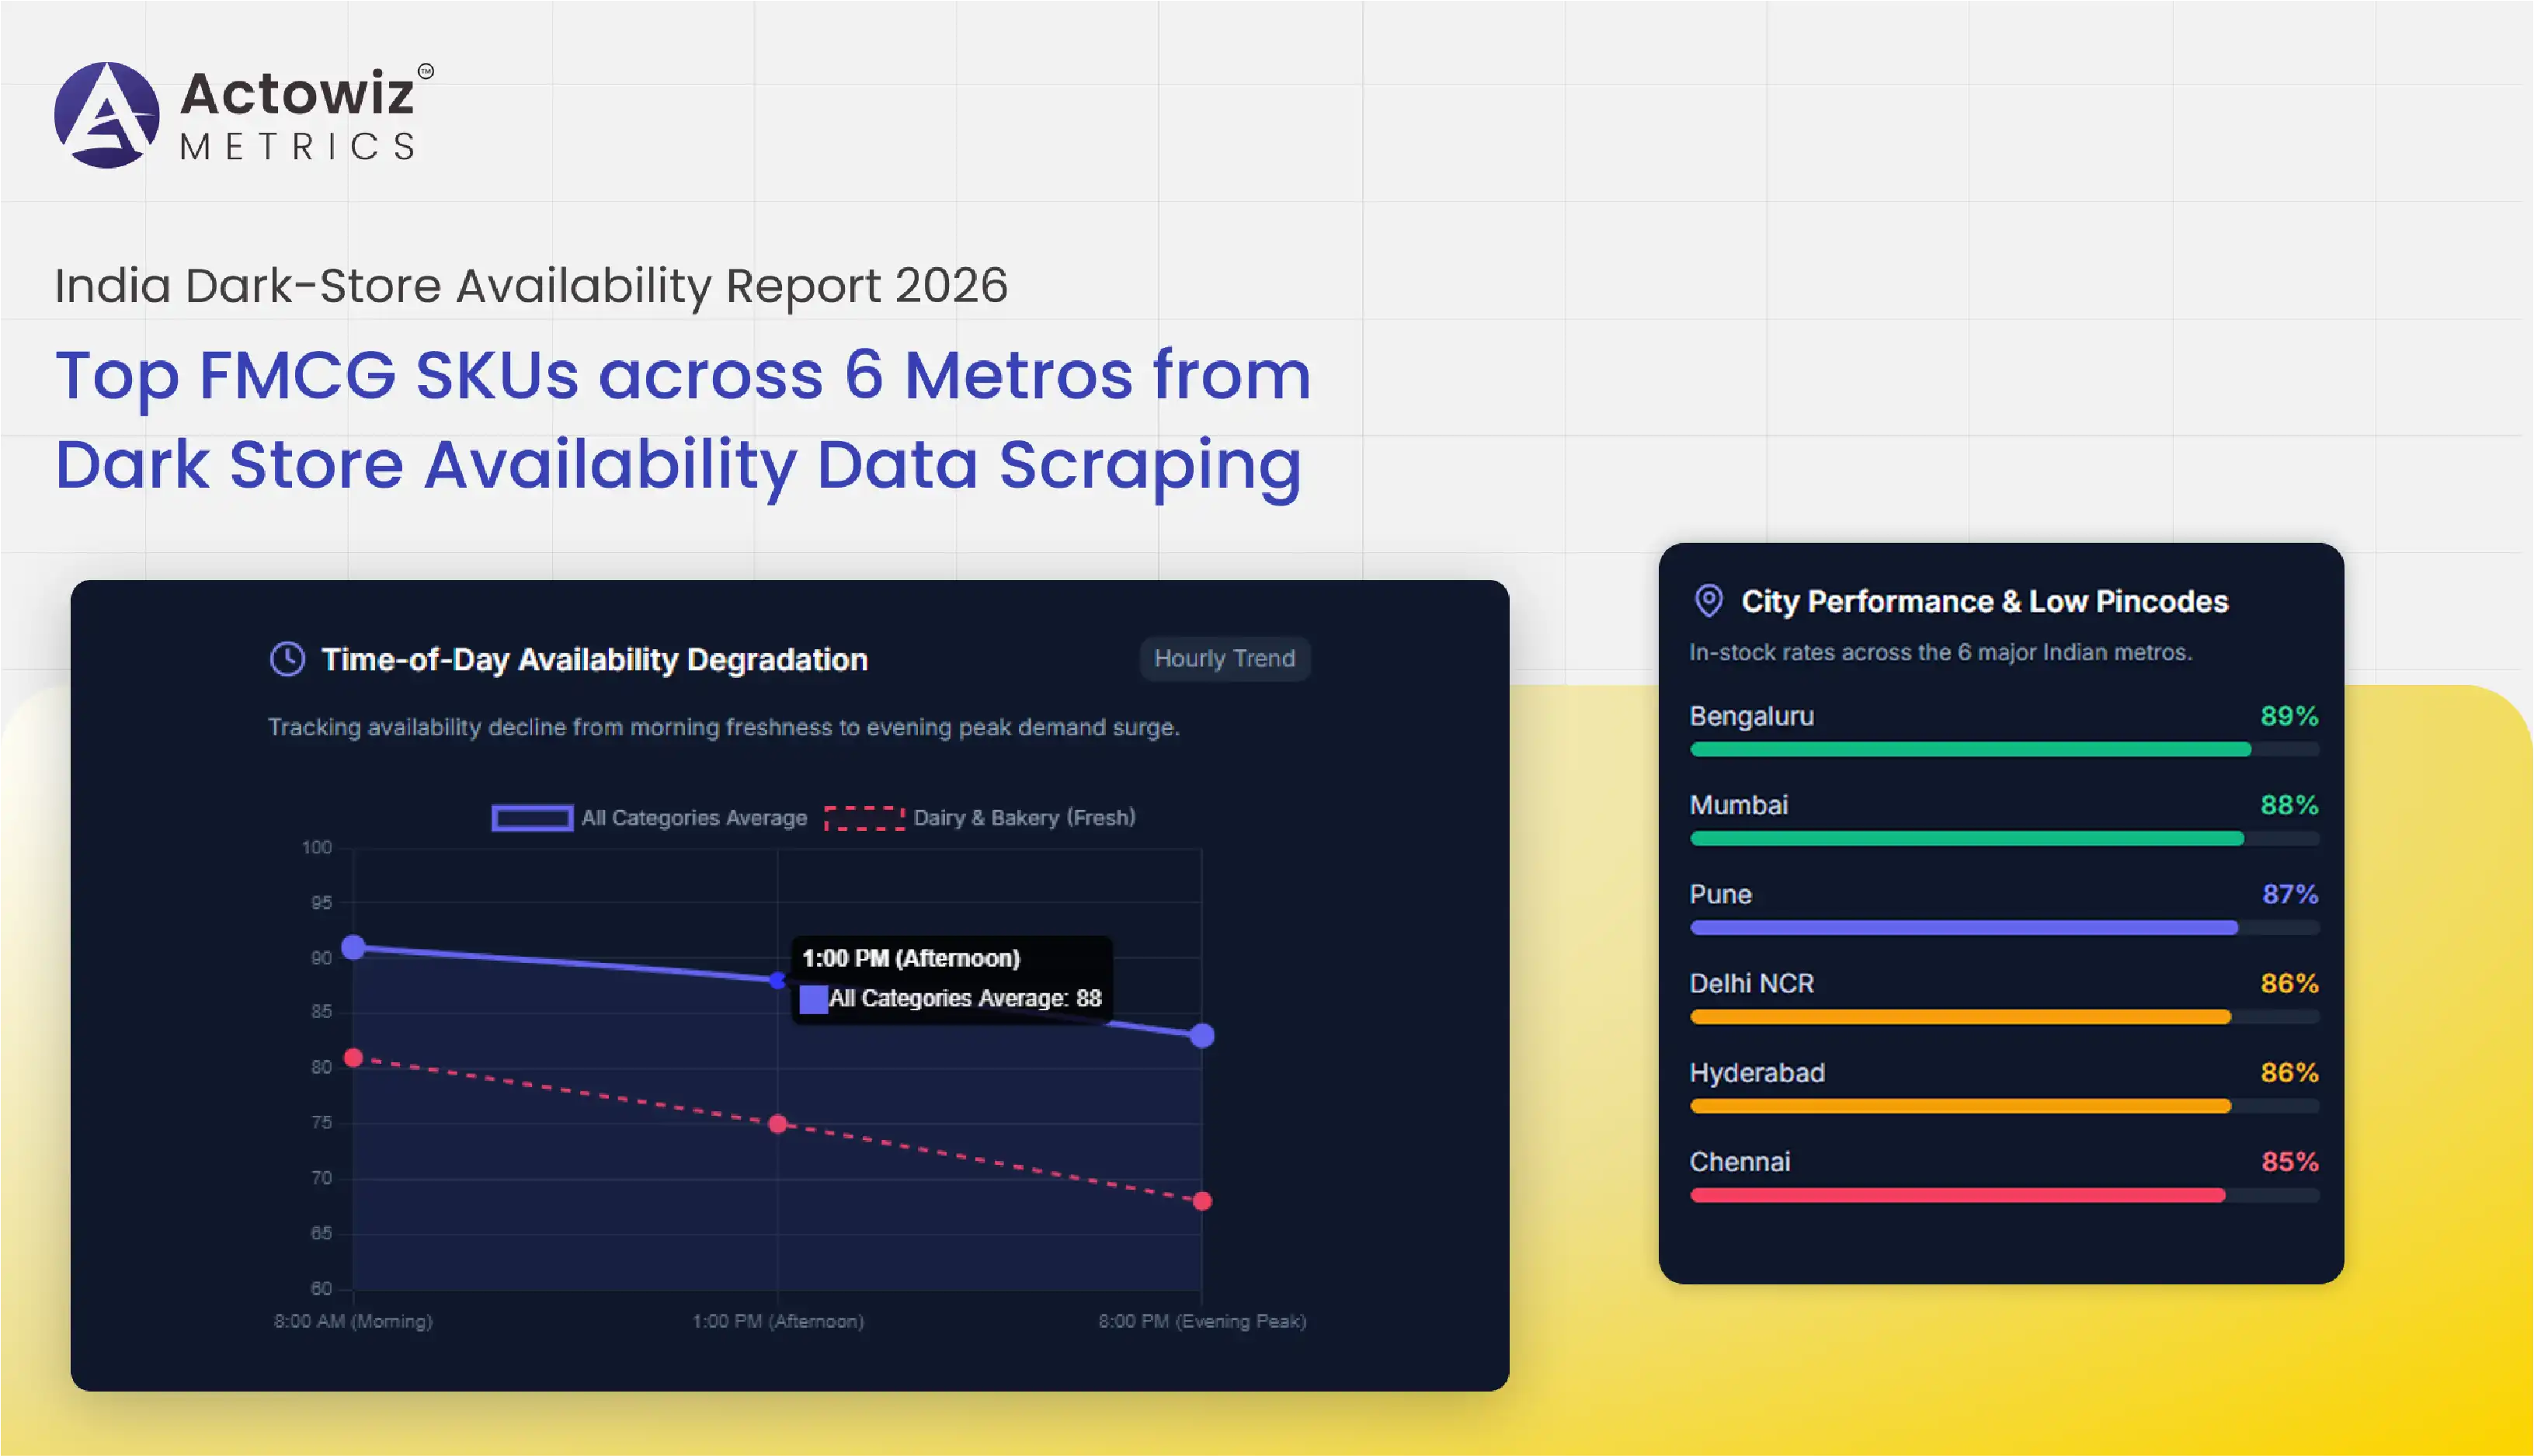
Fresh and chilled categories have the lowest availability, and the evening drop is steepest for dairy and bakery. Beverages also fall sharply in the evening, particularly in warm months.
| City | In-stock rate | Share of pincodes below 75% |
|---|---|---|
| Bengaluru | 89% | 6% |
| Mumbai | 88% | 8% |
| Delhi NCR | 86% | 12% |
| Pune | 87% | 9% |
| Hyderabad | 86% | 11% |
| Chennai | 85% | 13% |
All values illustrative.
| Time slot | In-stock rate, all categories |
|---|---|
| 8 am | 91% |
| 1 pm | 88% |
| 8 pm | 83% |
All values illustrative.
Evening is when quick-commerce demand peaks for many categories, and it is also when availability is lowest. That is where lost sales concentrate.
The worst-performing 10% of pincodes had in-stock rates below 70%. These were often in newer residential areas served by recently opened dark stores, where demand forecasting is less mature, or in very high-demand central areas where stock runs out quickly.
| Category (illustrative) | Leading brand in-stock rate | Challenger brand in-stock rate | Gap |
|---|---|---|---|
| Curd | 88% | 74% | 14 pts |
| Packaged bread | 85% | 72% | 13 pts |
| Energy drinks | 92% | 81% | 11 pts |
| Chips | 94% | 86% | 8 pts |
All values illustrative.
Leading brands generally achieve better availability, often through stronger distributor service and closer forecasting with platforms. For challengers, closing the availability gap may be cheaper than winning share through discounts.
In the sample, SKUs that were in stock ranked on average 3 to 5 positions higher for their main keyword than the same SKUs when out of stock. Availability directly affects visibility.
| Day | In-stock rate, all categories | In-stock rate, dairy and bakery |
|---|---|---|
| Monday | 88% | 81% |
| Wednesday | 88% | 80% |
| Friday | 86% | 76% |
| Saturday | 84% | 72% |
| Sunday | 85% | 73% |
All values illustrative.
Weekends show lower availability, particularly for fresh categories, as household orders rise and replenishment schedules do not always keep pace.
Availability is not only about stock-outs. In the sample, about 8% of top SKUs were not listed at all in a given pincode, even though they were listed in neighbouring pincodes. These listing gaps are often caused by catalogue set-up in individual dark stores, and they are usually quicker to fix than supply problems. Dark store availability data scraping distinguishes "not listed" from "out of stock" so brands can raise the right issue with the right team.
| Issue type | Share of unavailable checks | Typical fix |
|---|---|---|
| Out of stock (listed) | 62% | Replenishment, forecasting |
| Not listed in this dark store | 31% | Catalogue activation with platform |
| Listed but not deliverable | 7% | Delivery-zone or serviceability issue |
All values illustrative.
{
  "platform": "zepto",
  "city": "Chennai",
  "pincode": "600041",
  "time_slot": "20:00",
  "category": "Dairy and eggs",
  "sku_name": "Sample Toned Milk 500 ml",
  "brand": "Sample Dairy",
  "listed": true,
  "in_stock": false,
  "low_stock_message": null,
  "price_inr": 28,
  "delivery_minutes": null,
  "collected_at": "2026-10-04T20:00:00+05:30"
}Availability data can be combined with a brand's own sales data to estimate lost sales. A simple approach:
| SKU (illustrative) | Weekly sales when in stock | Out-of-stock share | Estimated weekly sales lost |
|---|---|---|---|
| Curd 400 g | 12,000 units | 22% | 2,640 units |
| Paneer 200 g | 6,500 units | 28% | 1,820 units |
| Toned milk 500 ml | 40,000 units | 9% | 3,600 units |
All values illustrative. This simple method assumes sales would have continued at the in-stock rate; brands should adjust for substitution and demand timing.
From daily to several times per hour for priority SKUs and pincodes.
Yes. Most brands track their full quick-commerce range plus key competitor SKUs.
Blinkit, Zepto and Swiggy Instamart, plus Flipkart Minutes, BigBasket and other services on request.
No. Actowiz Metrics collects public product availability information only.
On quick commerce, availability is visibility, and visibility is sales. Dark store availability data scraping shows that even top FMCG SKUs are unavailable in a meaningful share of checks, with the biggest gaps in the evening, in fresh categories and in specific pincodes. Brands that measure availability at this level can target the gaps that matter most.
Actowiz Metrics delivers dark store availability data scraping, share-of-search and price tracking for FMCG brands across India's quick-commerce platforms. Book a 15-minute demo to see your availability by pincode and time slot.
Expert blogs, research reports and infographics — practical, data-driven reading across e-commerce and quick-commerce.
Most fields are optional — the more you share, the better your sample.
.webp "infographics")
.webp "infographics")