BLOG


India’s food tech ecosystem, led by Swiggy and Zomato, has evolved into a high-intensity pricing battleground. With rapid expansion across Tier 1, Tier 2, and emerging Tier 3 cities, competitive benchmarking is no longer optional—it is mission-critical. Dynamic pricing, delivery fees, surge charges, and discount campaigns fluctuate daily, directly impacting restaurant margins and consumer demand.
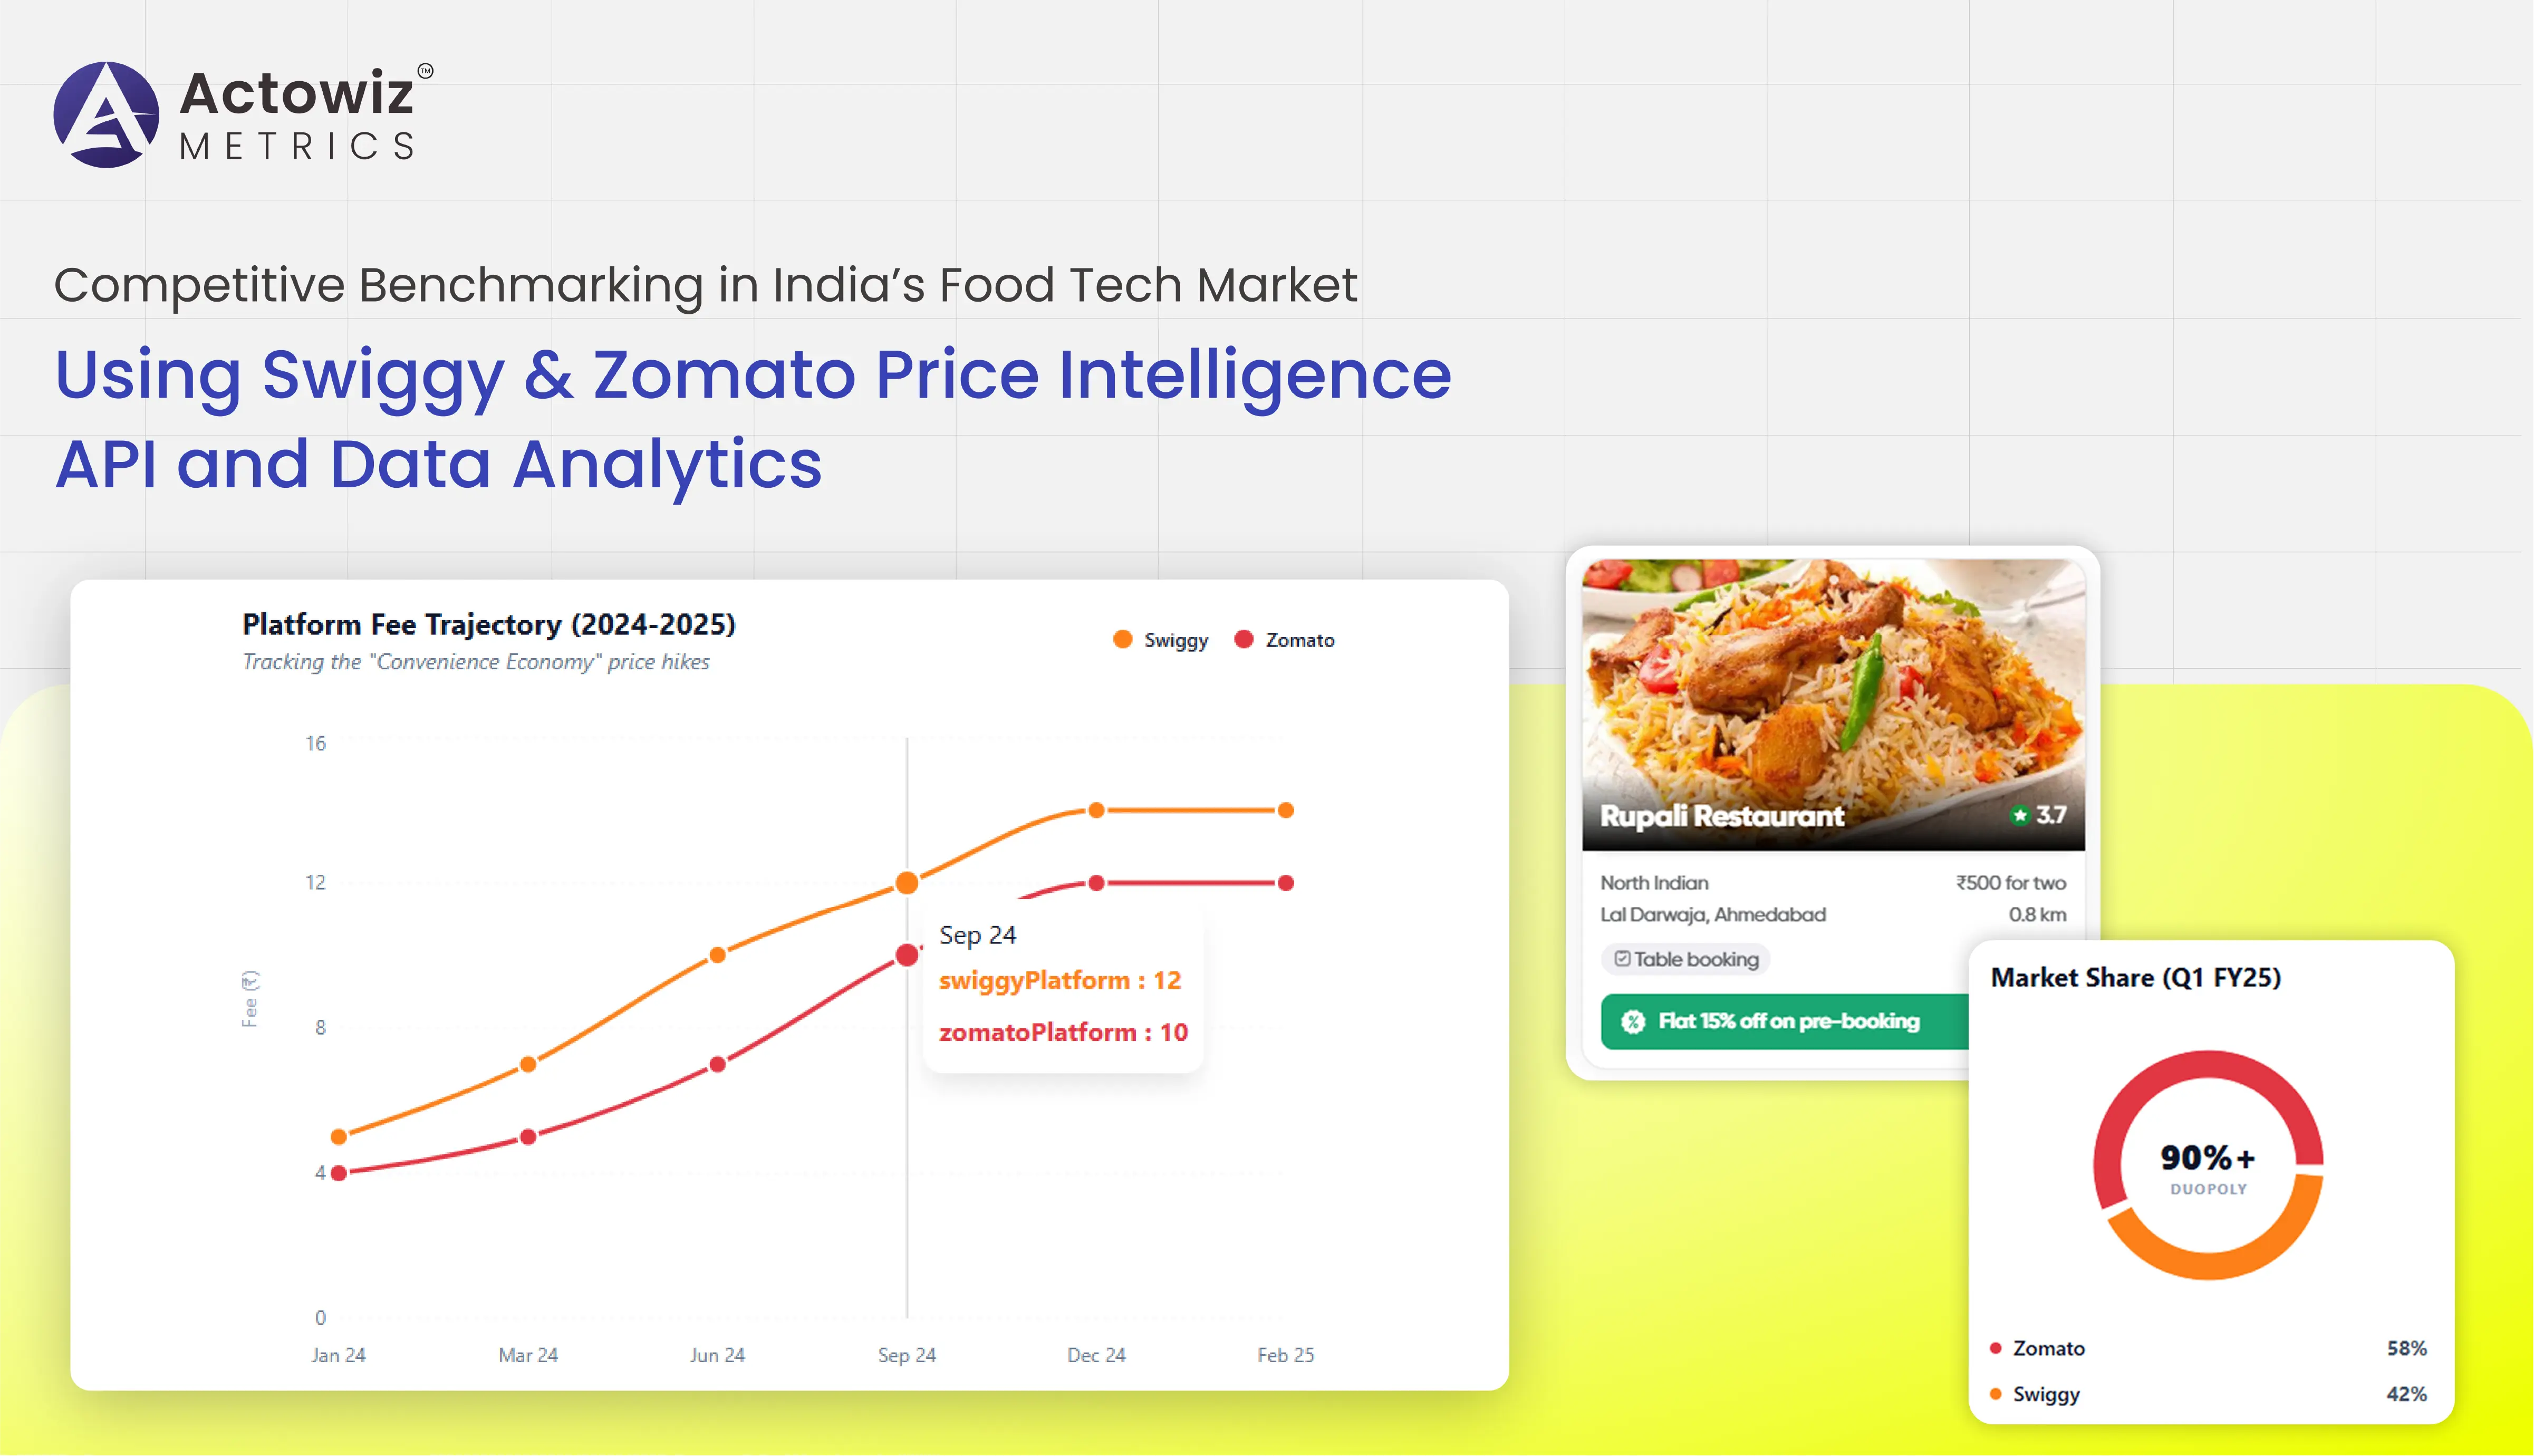
Actowiz Metrics leverages the Swiggy & Zomato Price Intelligence API to help brands, cloud kitchens, aggregators, and QSR chains gain real-time visibility into menu prices, platform commissions, promotional trends, and competitor positioning. Through structured data analytics and automated monitoring, businesses can detect pricing gaps, measure discount depth, and optimize listings for revenue growth.
Between 2020 and 2026, India’s online food delivery market is projected to grow at a CAGR exceeding 18%, intensifying the need for advanced analytics. This report explores how structured Price Benchmarking transforms reactive pricing into proactive strategy—enabling brands to dominate competitive landscapes with data-driven precision.
India’s food delivery sector has witnessed significant changes in pricing dynamics from 2020 to 2026. Pandemic-induced demand spikes, increased platform commissions, and delivery fee experimentation reshaped pricing structures.
| Year | Avg Order Value (₹) | Avg Discount % | Platform Fee % | Active Restaurants (mn) |
|---|---|---|---|---|
| 2020 | 320 | 22% | 18% | 0.18 |
| 2021 | 350 | 25% | 20% | 0.22 |
| 2022 | 390 | 21% | 22% | 0.28 |
| 2023 | 420 | 19% | 23% | 0.34 |
| 2024 | 460 | 17% | 24% | 0.39 |
| 2025* | 495 | 16% | 24% | 0.44 |
| 2026* | 530 | 15% | 25% | 0.50 |
Using Scrape Swiggy & Zomato Pricing Data, Actowiz Metrics identifies:
The competitive landscape is no longer defined by flat pricing. Instead, hyper-local pricing intelligence determines brand positioning. Restaurants without benchmarking tools risk margin erosion and reduced visibility in search rankings. Real-time monitoring empowers brands to adjust pricing daily rather than quarterly.
Menu-level analytics provides granular visibility into dish-level competitiveness. Tracking SKU-level changes helps brands optimize margins without losing order volume.
| Year | Avg Biryani Price (₹) | Avg Pizza Price (₹) | Avg Burger Price (₹) |
|---|---|---|---|
| 2020 | 220 | 280 | 140 |
| 2022 | 250 | 310 | 160 |
| 2024 | 290 | 345 | 180 |
| 2026* | 320 | 380 | 205 |
Through Swiggy & Zomato Menu Price Monitoring, brands can:
Menu-level benchmarking also reveals hidden costs such as packaging fees or surge pricing that impact final checkout value. Restaurants leveraging consistent price tracking saw up to 12% margin improvement between 2022–2024 by aligning menu rates with competitive clusters.
Discounting strategies significantly impact platform rankings and conversion rates. However, aggressive discounting often reduces profitability.
| Year | Avg Festival Discount % | Flash Sale Depth % | Subscription Benefit % |
|---|---|---|---|
| 2020 | 30% | 35% | 10% |
| 2022 | 28% | 32% | 12% |
| 2024 | 24% | 29% | 15% |
| 2026* | 22% | 25% | 18% |
With Discount & Offer Tracking from Swiggy & Zomato, businesses can:
Advanced analytics shows that brands balancing discount depth below 25% while improving listing visibility achieved 9–14% higher profitability compared to high-discount competitors. Smart benchmarking shifts focus from heavy discounting to strategic visibility.
Manual tracking is impossible in a marketplace updating thousands of SKUs hourly. Automation ensures scalability.
| Year | Avg Daily Price Changes | Delivery Fee Variations | Commission Adjustments |
|---|---|---|---|
| 2020 | 5,000 | 1,200 | 50 |
| 2023 | 18,000 | 3,800 | 120 |
| 2026* | 35,000 | 7,500 | 250 |
Using Extract Swiggy & Zomato Pricing Data, Actowiz Metrics builds:
Automation ensures data accuracy above 99% while reducing manual reporting time by 80%. Continuous extraction enables predictive modeling for price changes and surge detection.
Beyond menu pricing, hidden charges affect competitiveness—delivery fee surges, rain charges, and subscription waivers.
| Year | Avg Delivery Fee (₹) | Surge Multiplier | Platform Subscription Penetration |
|---|---|---|---|
| 2020 | 30 | 1.2x | 12% |
| 2023 | 40 | 1.4x | 22% |
| 2026* | 55 | 1.6x | 35% |
Through Web Scraping Swiggy & Zomato Prices, Discounts & Fees, brands gain visibility into:
Comprehensive visibility allows brands to adjust base pricing strategically rather than relying solely on discounts.
Market leaders continuously analyze bestseller rankings to adjust pricing and inventory.
Using Zomato Bestselling Food Brands Analytics, Actowiz Metrics identifies:
Brands aligning pricing within 5% of category leaders saw up to 18% higher repeat orders compared to misaligned competitors.
Actowiz Metrics combines advanced automation with predictive analytics to deliver actionable insights. Our proprietary dashboards integrate Product Data Tracking, pricing, discounts, platform fees, and bestseller rankings into unified reports.
With Swiggy Bestselling Food Brands Analytics and the Swiggy & Zomato Price Intelligence API, we empower brands to:
Our data engineering ensures compliance, accuracy, and scalability—helping food tech businesses transition from reactive pricing to strategic revenue optimization.
India’s food delivery ecosystem is entering a phase where micro-level pricing decisions determine macro-level growth. Competitive benchmarking powered by Food Analytics is no longer optional—it is foundational to sustainable profitability.
By leveraging the Swiggy & Zomato Price Intelligence API, businesses gain real-time visibility into pricing trends, discount strategies, and bestseller performance. Data-backed insights drive smarter pricing, stronger margins, and improved customer retention.
Actowiz Metrics stands at the forefront of food tech intelligence—delivering precision analytics that transforms price wars into profitable growth strategies. Our advanced Competitor Analysis ensures brands benchmark smarter and seize growth opportunities. Ready to benchmark smarter and grow faster?
Partner with Actowiz Metrics today for advanced competitive pricing intelligence.
Expert blogs, research reports and infographics — practical, data-driven reading across e-commerce and quick-commerce.
Most fields are optional — the more you share, the better your sample.


.webp "infographics")
.webp "infographics")


