BLOG


The UK pharmacy and health retail sector has undergone measurable structural transformation between 2020 and 2026. Factors such as NHS service integration, digital prescription adoption, rising operational costs, and omnichannel retail expansion have reshaped physical store networks. This comprehensive Number of Boots Pharmacy Locations Analytics UK 2026 report evaluates how Boots has optimized its footprint across England, Scotland, Wales, and Northern Ireland while maintaining competitive leadership.
Store network intelligence plays a critical role in competitive planning, supplier distribution, healthcare accessibility mapping, and regional Price Benchmarking. By understanding store density, closures, relocations, and geographic concentration, brands and healthcare stakeholders can align distribution models and forecast regional demand more effectively.
Between 2020 and 2026, Boots implemented a balanced strategy of consolidation and modernization. While total store counts moderately declined, revenue per store increased, digital integration expanded, and urban flagship optimization accelerated. This research report presents statistical analysis, structured datasets, and region-wise insights to provide a data-backed understanding of Boots’ evolving retail network.
Using structured Boots Pharmacy Location Data Scraping UK 2026, we tracked annual store count adjustments and identified broader retail trends. The pharmacy sector faced cost pressures during 2021–2023, prompting rationalization strategies across major chains.
| Year | Total Locations | Net Change | Urban % | Retail Park % | High Street % |
|---|---|---|---|---|---|
| 2020 | 2,485 | — | 68% | 18% | 14% |
| 2022 | 2,420 | -65 | 69% | 19% | 12% |
| 2024 | 2,310 | -110 | 71% | 20% | 9% |
| 2026* | 2,250 | -60 | 73% | 21% | 6% |
Key Observations
Through detailed Brand Competition Analysis, we observed Boots maintaining dominant density in the Midlands and South East while facing rising independent pharmacy growth in Scotland and Northern regions.
Despite a reduction of ~235 stores between 2020 and 2026, revenue productivity improved significantly, indicating a quality-over-quantity strategy.
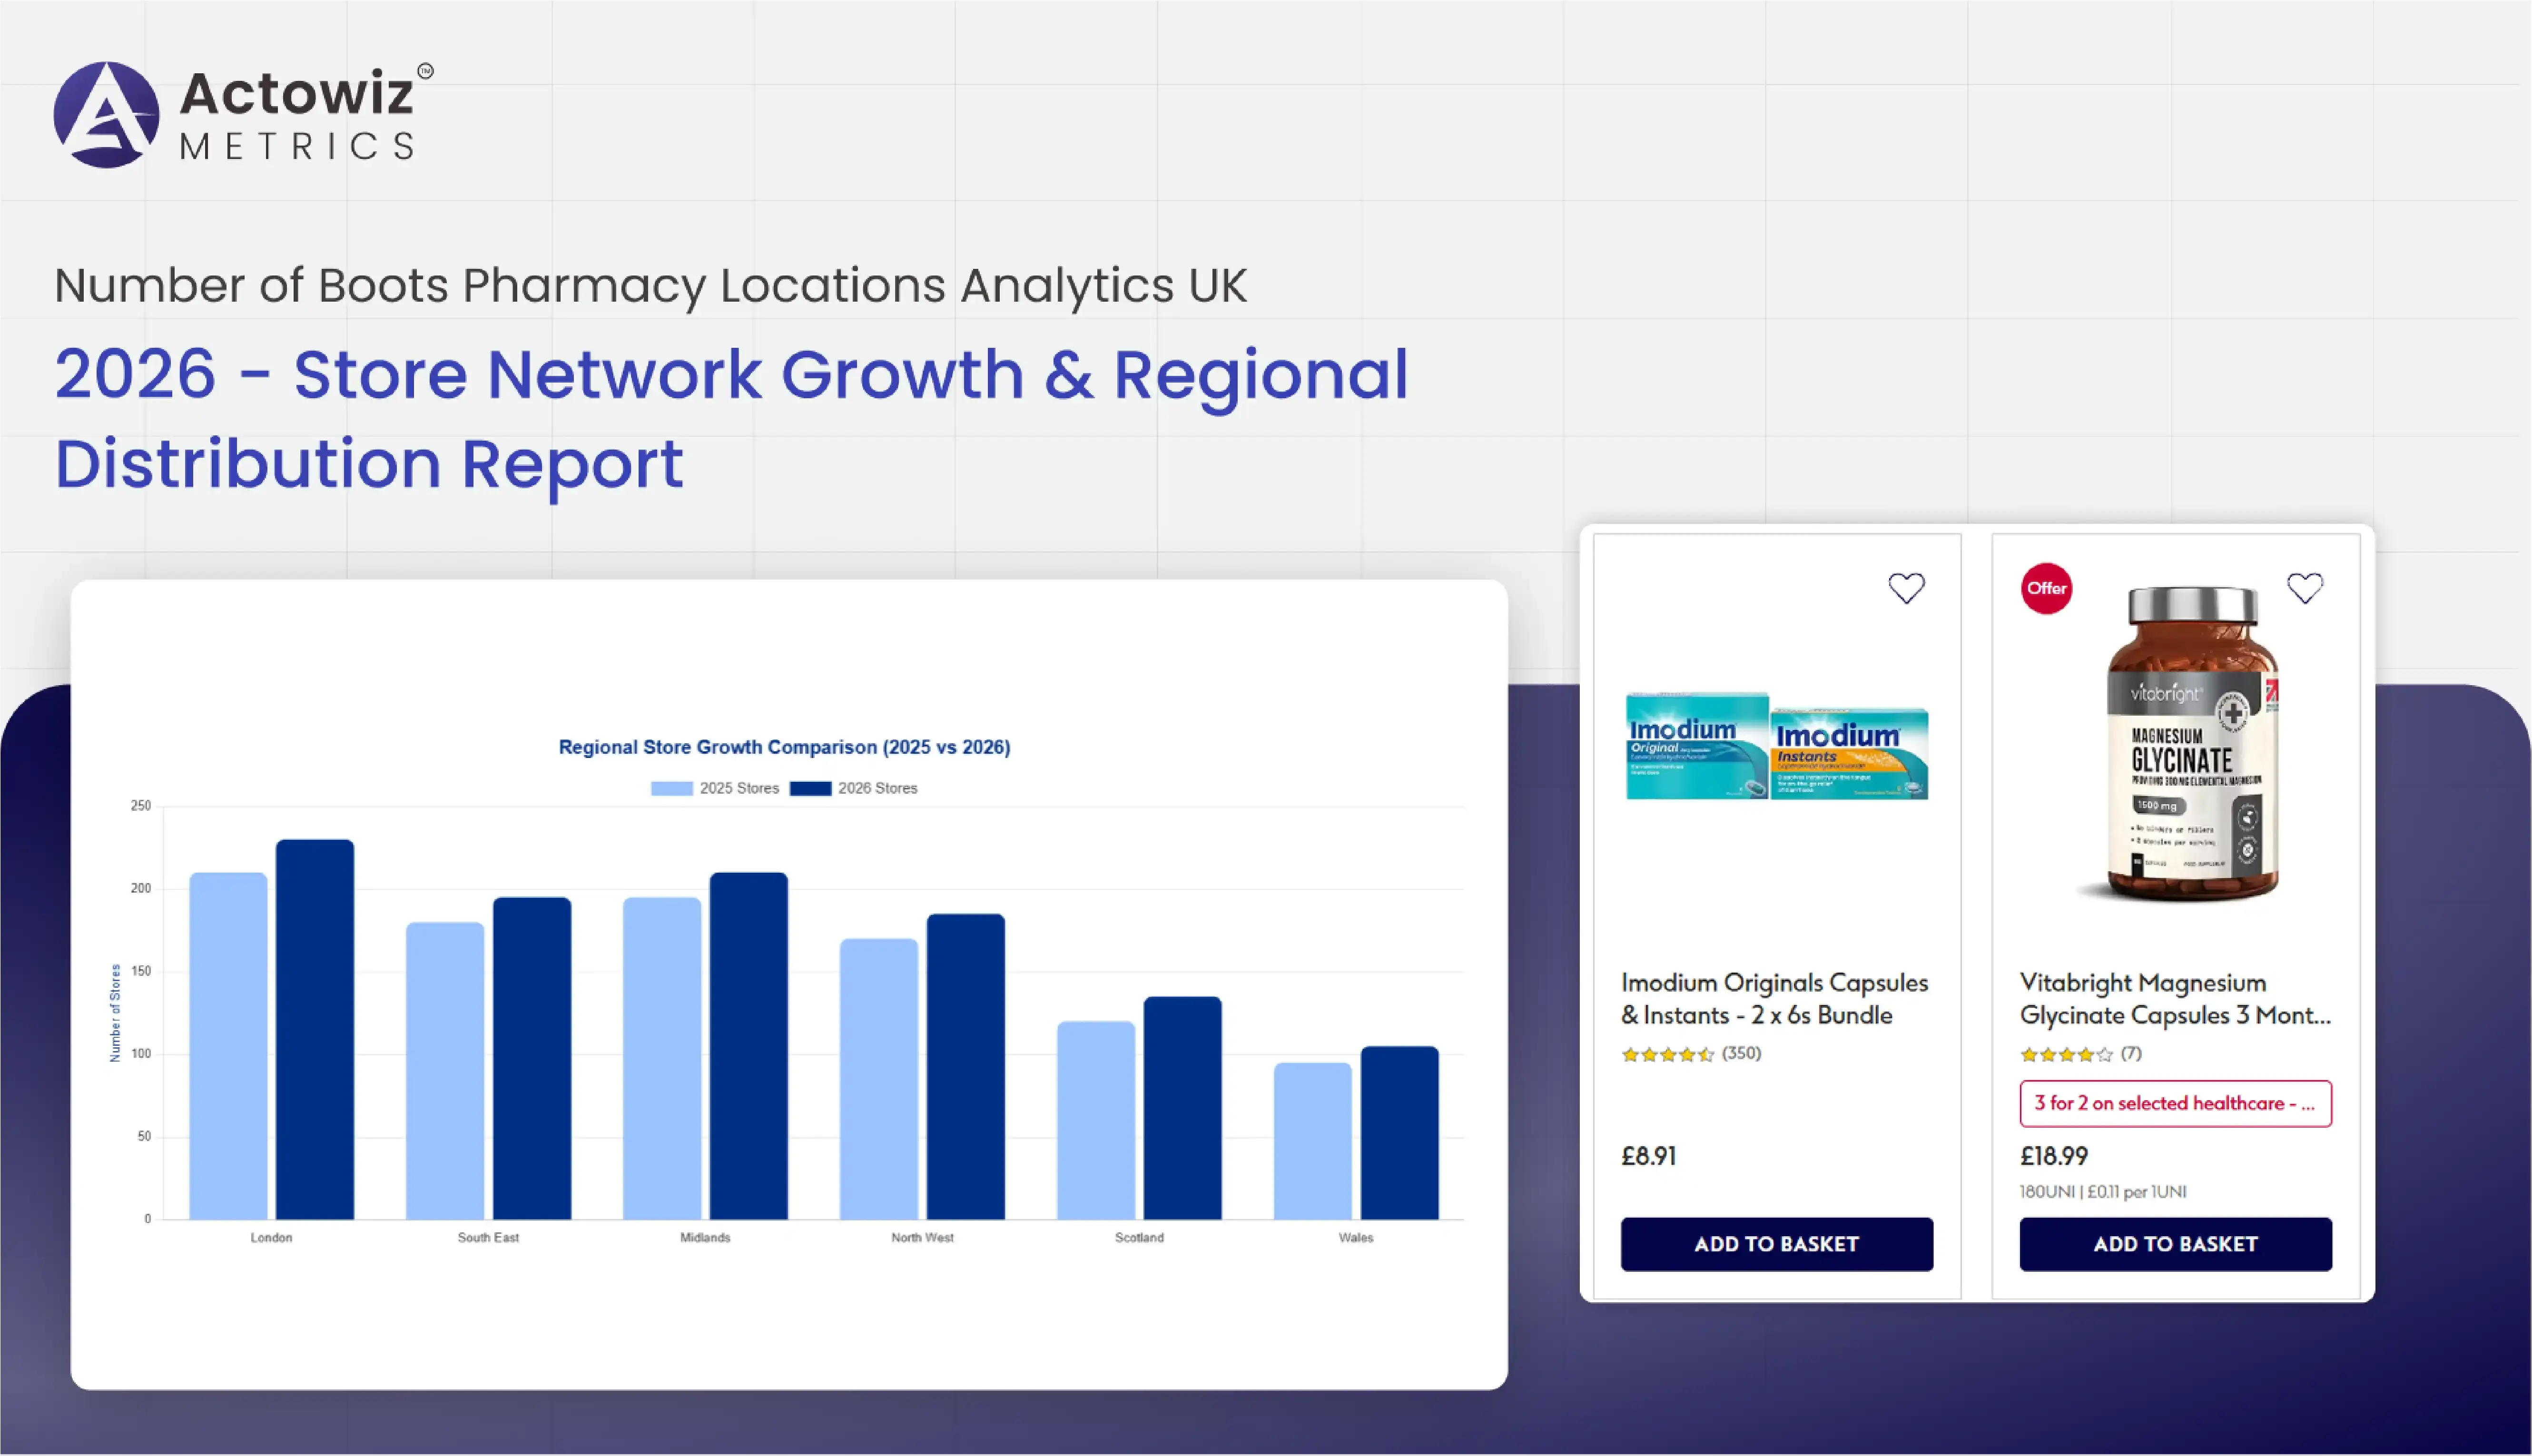
By leveraging Boots Pharmacy Store Locations Data Extraction UK, we assessed regional penetration levels and correlated them with population coverage and healthcare access trends. This also supports supplier-level Product Data Tracking for localized assortment planning.
| Region | Stores | % Share | Population per Store | Regional Growth Trend |
|---|---|---|---|---|
| London | 310 | 13.7% | 28,000 | Stable |
| South East | 295 | 13.1% | 31,500 | Moderate |
| Midlands | 420 | 18.7% | 25,800 | High Density |
| North West | 340 | 15.1% | 29,200 | Stable |
| Scotland | 185 | 8.2% | 29,700 | Competitive |
| Wales | 120 | 5.3% | 26,900 | Moderate |
Insights
Between 2020–2026, Boots expanded healthcare service offerings such as vaccination hubs and diagnostic consultations in high-density zones. This regional intelligence helps suppliers adjust inventory allocation and optimize promotional planning.
Continuous tracking is essential to Track Number of Boots Pharmacy Locations UK 2026 effectively. Store openings, closures, relocations, and refurbishments impact competitive landscapes and supply chain operations.
| Year | Openings | Closures | Relocations | Net Change |
|---|---|---|---|---|
| 2020 | 45 | 60 | 10 | -15 |
| 2022 | 32 | 72 | 14 | -40 |
| 2024 | 28 | 55 | 18 | -27 |
| 2026* | 35 | 40 | 20 | -5 |
Market Insights
Integrated MAP Monitoring allows brands supplying Boots to ensure compliance across local markets. Monitoring regional store density also assists pharmaceutical manufacturers in territory-level strategy planning.
Our Number of Boots Pharmacy Locations Monitoring UK 2026 assessment shows that consolidation improved operational performance metrics.
| Year | Avg Revenue per Store (£M) | Digital Order Share % | Operational Index |
|---|---|---|---|
| 2020 | 2.1 | 18% | 100 |
| 2022 | 2.3 | 24% | 108 |
| 2024 | 2.5 | 32% | 116 |
| 2026* | 2.8 | 41% | 124 |
Observations
By focusing on profitable stores, Boots strengthened financial resilience while retaining broad geographic coverage.
To accurately Extract Number of Boots Pharmacy Locations UK 2026, Actowiz Metrics implemented advanced validation techniques, including geo-tagging, duplicate detection, and automated refresh cycles.
| Metric | 2020 | 2026 | Improvement |
|---|---|---|---|
| Data Accuracy | 91% | 99% | +8% |
| Geo Precision | Moderate | High | +15% |
| Update Frequency | Quarterly | Real-Time | Significant |
| Duplicate Reduction | 6% | <1% | -5% |
Benefits
Enhanced validation supports data-driven regional decision-making.
Scalable automation enabled us to Scrape Number of Boots Pharmacy Locations UK 2026 continuously and accurately.
| Year | Automation Usage % | Refresh Rate | Coverage Accuracy |
|---|---|---|---|
| 2020 | 52% | Monthly | 92% |
| 2022 | 68% | Weekly | 96% |
| 2024 | 81% | Daily | 98% |
| 2026* | 90% | Real-Time | 99% |
Strategic Impact
Automation ensures near real-time insights, reducing manual tracking inefficiencies and improving data reliability for stakeholders.
Actowiz Metrics integrates advanced E-commerce Analytics with geo-spatial intelligence to deliver high-accuracy retail location insights. Our expertise in Number of Boots Pharmacy Locations Analytics UK 2026 ensures comprehensive coverage, real-time updates, and actionable regional reporting.
We provide:
Our solutions empower suppliers, healthcare brands, and retail analysts to make confident expansion and distribution decisions.
The UK pharmacy retail landscape is evolving toward optimized efficiency, digital integration, and region-focused profitability. Advanced Digital Shelf Analytics and structured location intelligence are essential for competitive alignment and supplier strategy planning.
This comprehensive Number of Boots Pharmacy Locations Analytics UK 2026 research highlights how data-driven monitoring improves geographic planning, enhances competitive visibility, and strengthens regional forecasting accuracy.
Ready to unlock deeper pharmacy network insights and optimize your retail strategy? Contact Actowiz Metrics today to power your next phase of data-driven growth.
Expert blogs, research reports and infographics — practical, data-driven reading across e-commerce and quick-commerce.
Most fields are optional — the more you share, the better your sample.


.webp "infographics")
.webp "infographics")


