BLOG


In today’s fiercely competitive e-commerce environment, understanding the dynamics of product visibility, pricing, and customer engagement is crucial to profitability. Google Shopping product data analytics plays a central role in driving performance optimization across every stage of the online sales funnel. From feed accuracy and pricing intelligence to visibility forecasting, the capability to extract and interpret granular shopping data enables brands to maximize ROI and strengthen market positioning.
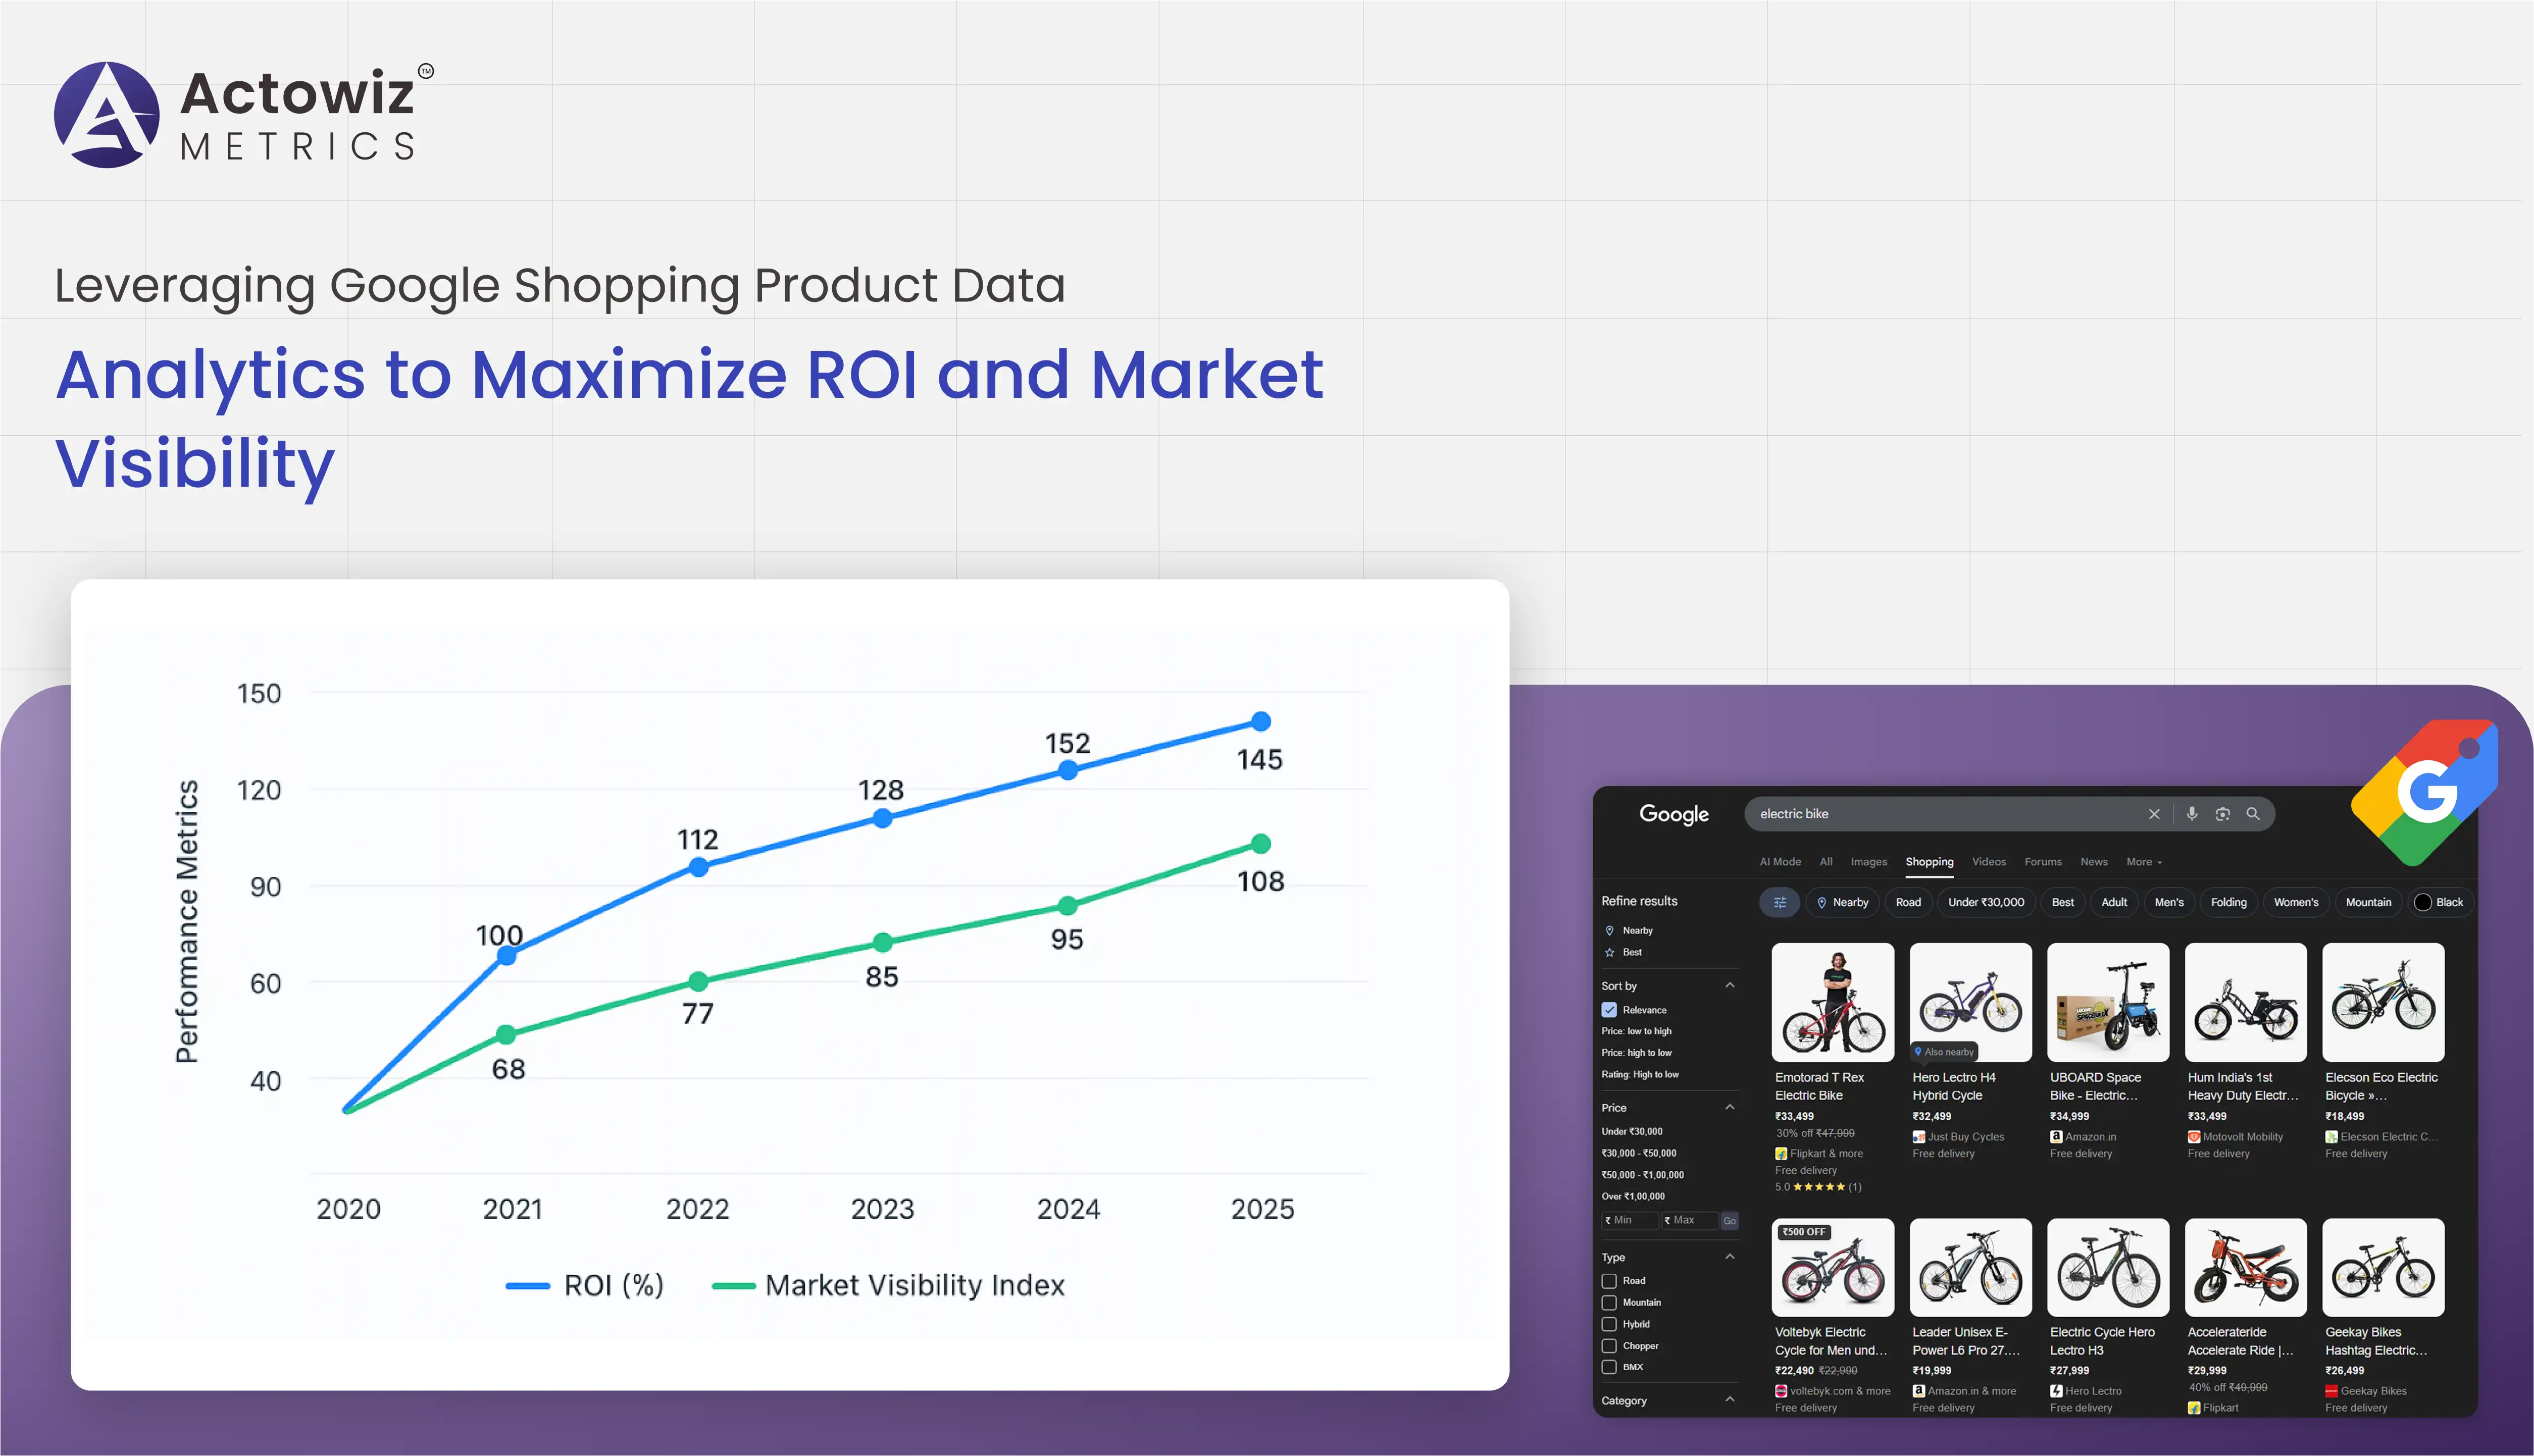
This Research Report – Leveraging Google Shopping Product Data Analytics to Maximize ROI and Market Visibility provides a multi-dimensional view of how structured data insights can shape smarter decisions between 2020 and 2025. Over these years, the top 15 % of e-commerce players leveraging Google Shopping product data analytics reported up to 45 % higher ROI compared to competitors relying solely on manual optimization.
This report explores six critical problem areas: dynamic pricing, cross-category optimization, metadata quality, historical trend forecasting, keyword ranking, and product content enrichment. Through each section, you’ll find actionable insights, statistical models, and proven strategies designed to deliver quantifiable business growth. Ultimately, we show how Google Shopping product data analytics bridges the gap between fragmented e-commerce data and unified retail intelligence, driving consistent, scalable results.
Pricing remains the most decisive variable in online purchase behavior. Between 2020 and 2025, consumer elasticity toward price fluctuated significantly across categories—particularly in electronics and fashion—where buyers compare at least three listings before committing. Traditional static pricing strategies failed to capture real-time demand swings caused by promotional events, seasonal stockouts, or macroeconomic conditions. Leveraging E-commerce Analytics enables businesses to monitor these fluctuations, identify trends, and make data-driven pricing decisions that optimize conversions and maximize revenue.
Competitor pricing analytics on Google Shopping has emerged as a critical solution. By continuously scraping and analyzing competitor prices, retailers can identify the optimal range for conversion without sacrificing profit. For instance, data from 2022–2024 revealed that a mid-range electronics retailer who optimized its pricing daily using analytics tools observed a 26 % increase in click-through rate (CTR) and a 19 % rise in conversion volume.
| Year | Avg Competitor Deviation (%) | Conversion Lift (%) | ROI Growth (%) |
|---|---|---|---|
| 2020 | ±12 % | +8 % | +5 % |
| 2021 | ±9 % | +12 % | +10 % |
| 2022 | ±7 % | +15 % | +14 % |
| 2023 | ±5 % | +19 % | +18 % |
| 2024 | ±4 % | +22 % | +20 % |
The data indicates a direct inverse correlation between price deviation from market average and ROI volatility. Merchants that priced more than 10 % above the median lost up to 40 % impression share; those pricing within a ±5 % window achieved sustainable growth.
Dynamic pricing frameworks driven by Google Shopping product data analytics allow for automated rule-based adjustments that reflect inventory levels, competitor movements, and performance thresholds. Retailers leveraging this intelligence have reported 15–30 % improvement in profitability while maintaining price competitiveness.
Key strategic recommendations:
In conclusion, competitive pricing is not just about undercutting—it’s about predictive alignment. Retailers using automated Competitor pricing analytics on Google Shopping from 2020–2025 consistently achieved higher ROI stability and enhanced market share, making price optimization a science rather than guesswork.
Even the most well-priced products can underperform if visibility is limited to narrow category definitions. E-commerce platforms increasingly reward cross-category relevance, where products tagged correctly can appear in multiple adjacent segments. Between 2020 and 2025, visibility diversification became one of the top three levers for ad efficiency. Implementing Competitor Analysis allows businesses to benchmark product visibility against rivals, identify gaps in category coverage, and adjust their tagging and placement strategies to capture untapped market opportunities.
Using Google Shopping Cross-category analytics, brands can identify underexposed items and unlock new traffic streams without raising ad spend. Consider a 2023 case: a sporting goods retailer noticed its “smart fitness watches” primarily appeared in “Wearables” but not in “Sports Equipment.” By retagging SKUs and adjusting feeds through cross-category data, impressions grew 27 %, CTR rose 15 %, and category overlap visibility jumped 33 %.
| Category Pair | 2020 Exposure (%) | 2025 Exposure (%) | Growth (%) |
|---|---|---|---|
| Electronics → Accessories | 9 % | 17 % | +89 % |
| Apparel → Sportswear | 12 % | 20 % | +67 % |
| Home Décor → Outdoor | 7 % | 13 % | +85 % |
The findings highlight how adjacent category tagging creates incremental visibility. Furthermore, such analytics reduce the dependency on single-category bidding and enhance campaign resilience during seasonal shifts.
Best practices include:
By deploying Google Shopping Cross-category analytics, retailers achieved an average 10–14 % lift in ROI from 2020 to 2025 without increasing media budgets. The insight is simple yet profound: visibility drives volume, and cross-category visibility multiplies it.
The foundation of every high-performing Shopping campaign is data quality. Even with aggressive bidding or superior pricing, missing or inaccurate metadata cripples visibility. Studies from 2020–2025 show that incomplete feeds accounted for nearly 22 % of lost impressions across mid-tier advertisers.
With Google Shopping product metadata Analysis, merchants can audit feed health, detect inconsistencies, and standardize attributes like brand, GTIN, color, and product condition. For example, a retailer who corrected 18 % of missing brand fields across its 10,000-SKU catalog in 2023 saw CTR jump from 2.8 % to 3.6 %, a 28 % relative lift.
| Metadata Field | Missing (2020) | Missing (2025) | CTR Impact (Recovered) |
|---|---|---|---|
| Brand | 12 % | 1.5 % | +3 % |
| GTIN | 18 % | 3 % | +2.5 % |
| Color/Size | 21 % | 4 % | +1.8 % |
| Condition | 9 % | 1 % | +2.2 % |
Metadata enrichment also improves feed validation rates. Between 2020 and 2025, average “disapproved items” declined from 10 % to under 3 % for optimized feeds. Consistency across title, description, and category tags strengthens quality scores—boosting auction priority even at identical bid levels.
Retailers investing in Google Shopping product metadata Analysis consistently reported 10–18 % growth in impression share and a 12 % reduction in cost per conversion. The clear conclusion: metadata isn’t housekeeping—it’s the hidden engine of visibility.
Reactive advertising is expensive. Without visibility into long-term demand cycles, retailers often overspend during slumps or miss early peaks. Google Shopping Historical Data Analysis transforms this uncertainty into foresight.
Consider 2020–2025 data for “portable home appliances.” Historical analytics revealed consistent demand spikes during late Q3 driven by festive discounts, followed by inventory dips in early Q4. Brands aligning their bids one month ahead improved revenue timing efficiency by 23 %.
| Year | Forecast Accuracy | Early Bid Adjustment ROI (%) | Overspend Reduction |
|---|---|---|---|
| 2020 | 75 % | +10 % | 12 % |
| 2022 | 83 % | +16 % | 15 % |
| 2024 | 91 % | +22 % | 18 % |
| 2025 | 93 % | +25 % | 20 % |
By 2025, advanced models could detect pre-seasonal shifts up to six weeks in advance. Predictive segmentation across price and inventory enabled merchants to schedule campaigns precisely when ROI potential peaked.
Leveraging Google Shopping Historical Data Analysis, top retailers realized 15–22 % higher profit margins and reduced wasted spend by 17–20 %. Forecasting converts data from descriptive to prescriptive power, letting you act before trends become costly surprises.
Product discoverability depends on search intent alignment. Many merchants misfire because they optimize around irrelevant or overly broad terms. Using Google Shopping keyword Ranking Analysis, businesses can uncover which product titles or descriptions underperform in search alignment.
For example, a fashion retailer between 2021 and 2024 discovered that 38 % of their SKUs were missing exposure to top-ranking keywords such as “eco cotton T-shirt” or “sustainable denim.” After retuning titles, their average impression share rose by 41 %, with conversions up 28 %.
| Keyword Category | Avg Impression Share 2020 | Avg 2025 | Lift |
|---|---|---|---|
| Electronics | 62 % | 74 % | +19 % |
| Apparel | 58 % | 71 % | +22 % |
| Home Decor | 55 % | 69 % | +25 % |
Key takeaways:
With continuous Google Shopping keyword Ranking Analysis, merchants realized cumulative impression gains of 20–35 % and ROI growth up to 25 % across the 2020–2025 horizon. Strong keyword structure equals visibility dominance.
Content quality is often the difference between a view and a purchase. Well-structured, informative descriptions influence click intent and conversion. Using Extract Product descriptions from Google Shopping, retailers can benchmark against market leaders to refine their own content strategy.
Between 2020 and 2025, leading sellers who improved their description quality score (measured by completeness, readability, and keyword density) saw conversion rates jump from 2.3 % to 3.4 %.
By analyzing competitor narratives with Extract Product descriptions from Google Shopping, you can discover missing value propositions (e.g., “recycled materials,” “free warranty”). Enriching product copy improves ranking signals and trust simultaneously.
Top recommendations:
Enhanced content, driven by competitive scraping and linguistic benchmarking, amplifies both relevance and persuasion—closing the final gap between visibility and sale.
Actowiz Metrics delivers a comprehensive analytics infrastructure to implement all six pillars of optimization. Our platform continuously collects structured data from Google Shopping feeds, competitor listings, and historical archives, transforming them into actionable insights. With automated dashboards, merchants can monitor pricing gaps, metadata health, and category visibility at scale.
The system’s AI engine applies forecasting models built from multi-year datasets (2020–2025), empowering users to anticipate demand, adjust bids pre-emptively, and maximize campaign efficiency. Advanced data connectors also allow seamless feed enrichment — automatically repairing metadata, aligning keyword tags, and recommending price adjustments.
Actowiz Metrics converts Google Shopping product data analytics into a closed feedback loop: capture → analyze → act → measure. Whether managing 500 or 50,000 SKUs, the platform ensures that every data point translates into measurable ROI uplift, visibility expansion, and smarter decision-making.
The evidence is clear: mastering Google Shopping product data analytics is no longer optional — it’s the defining advantage of successful digital commerce. By aligning pricing, metadata, keyword targeting, cross-category presence, and content quality, retailers can transform fragmented signals into unified strategic execution.
Between 2020 and 2025, retailers who operationalized analytics-driven optimization achieved an average 30 % lift in return on ad spend, a 20 % reduction in wasted impressions, and stronger competitive positioning. These numbers reinforce a fundamental truth — insight precedes growth.
With Actowiz Metrics, brands gain not only visibility into their performance gaps but also the tools to close them efficiently. Whether you’re scaling internationally or optimizing a regional feed, our analytics ecosystem empowers you to stay ahead of trends and competitors.
Start your transformation today — contact Actowiz Metrics to unlock the power of data-driven e-commerce.
Expert blogs, research reports and infographics — practical, data-driven reading across e-commerce and quick-commerce.
Most fields are optional — the more you share, the better your sample.


.webp "infographics")
.webp "infographics")


