Create your own


The U.S. quick-service and limited-service restaurant industry continues to expand rapidly, driven by digital ordering, delivery platforms, and data-driven menu strategies. Businesses increasingly rely on 10 Largest Limited-Service Restaurant Chains Analytics in USA – 2026 to understand competitive positioning, market share trends, and consumer demand patterns. Restaurants are leveraging advanced Food Analytics to evaluate performance across locations, optimize pricing strategies, and monitor brand competition in an evolving market.
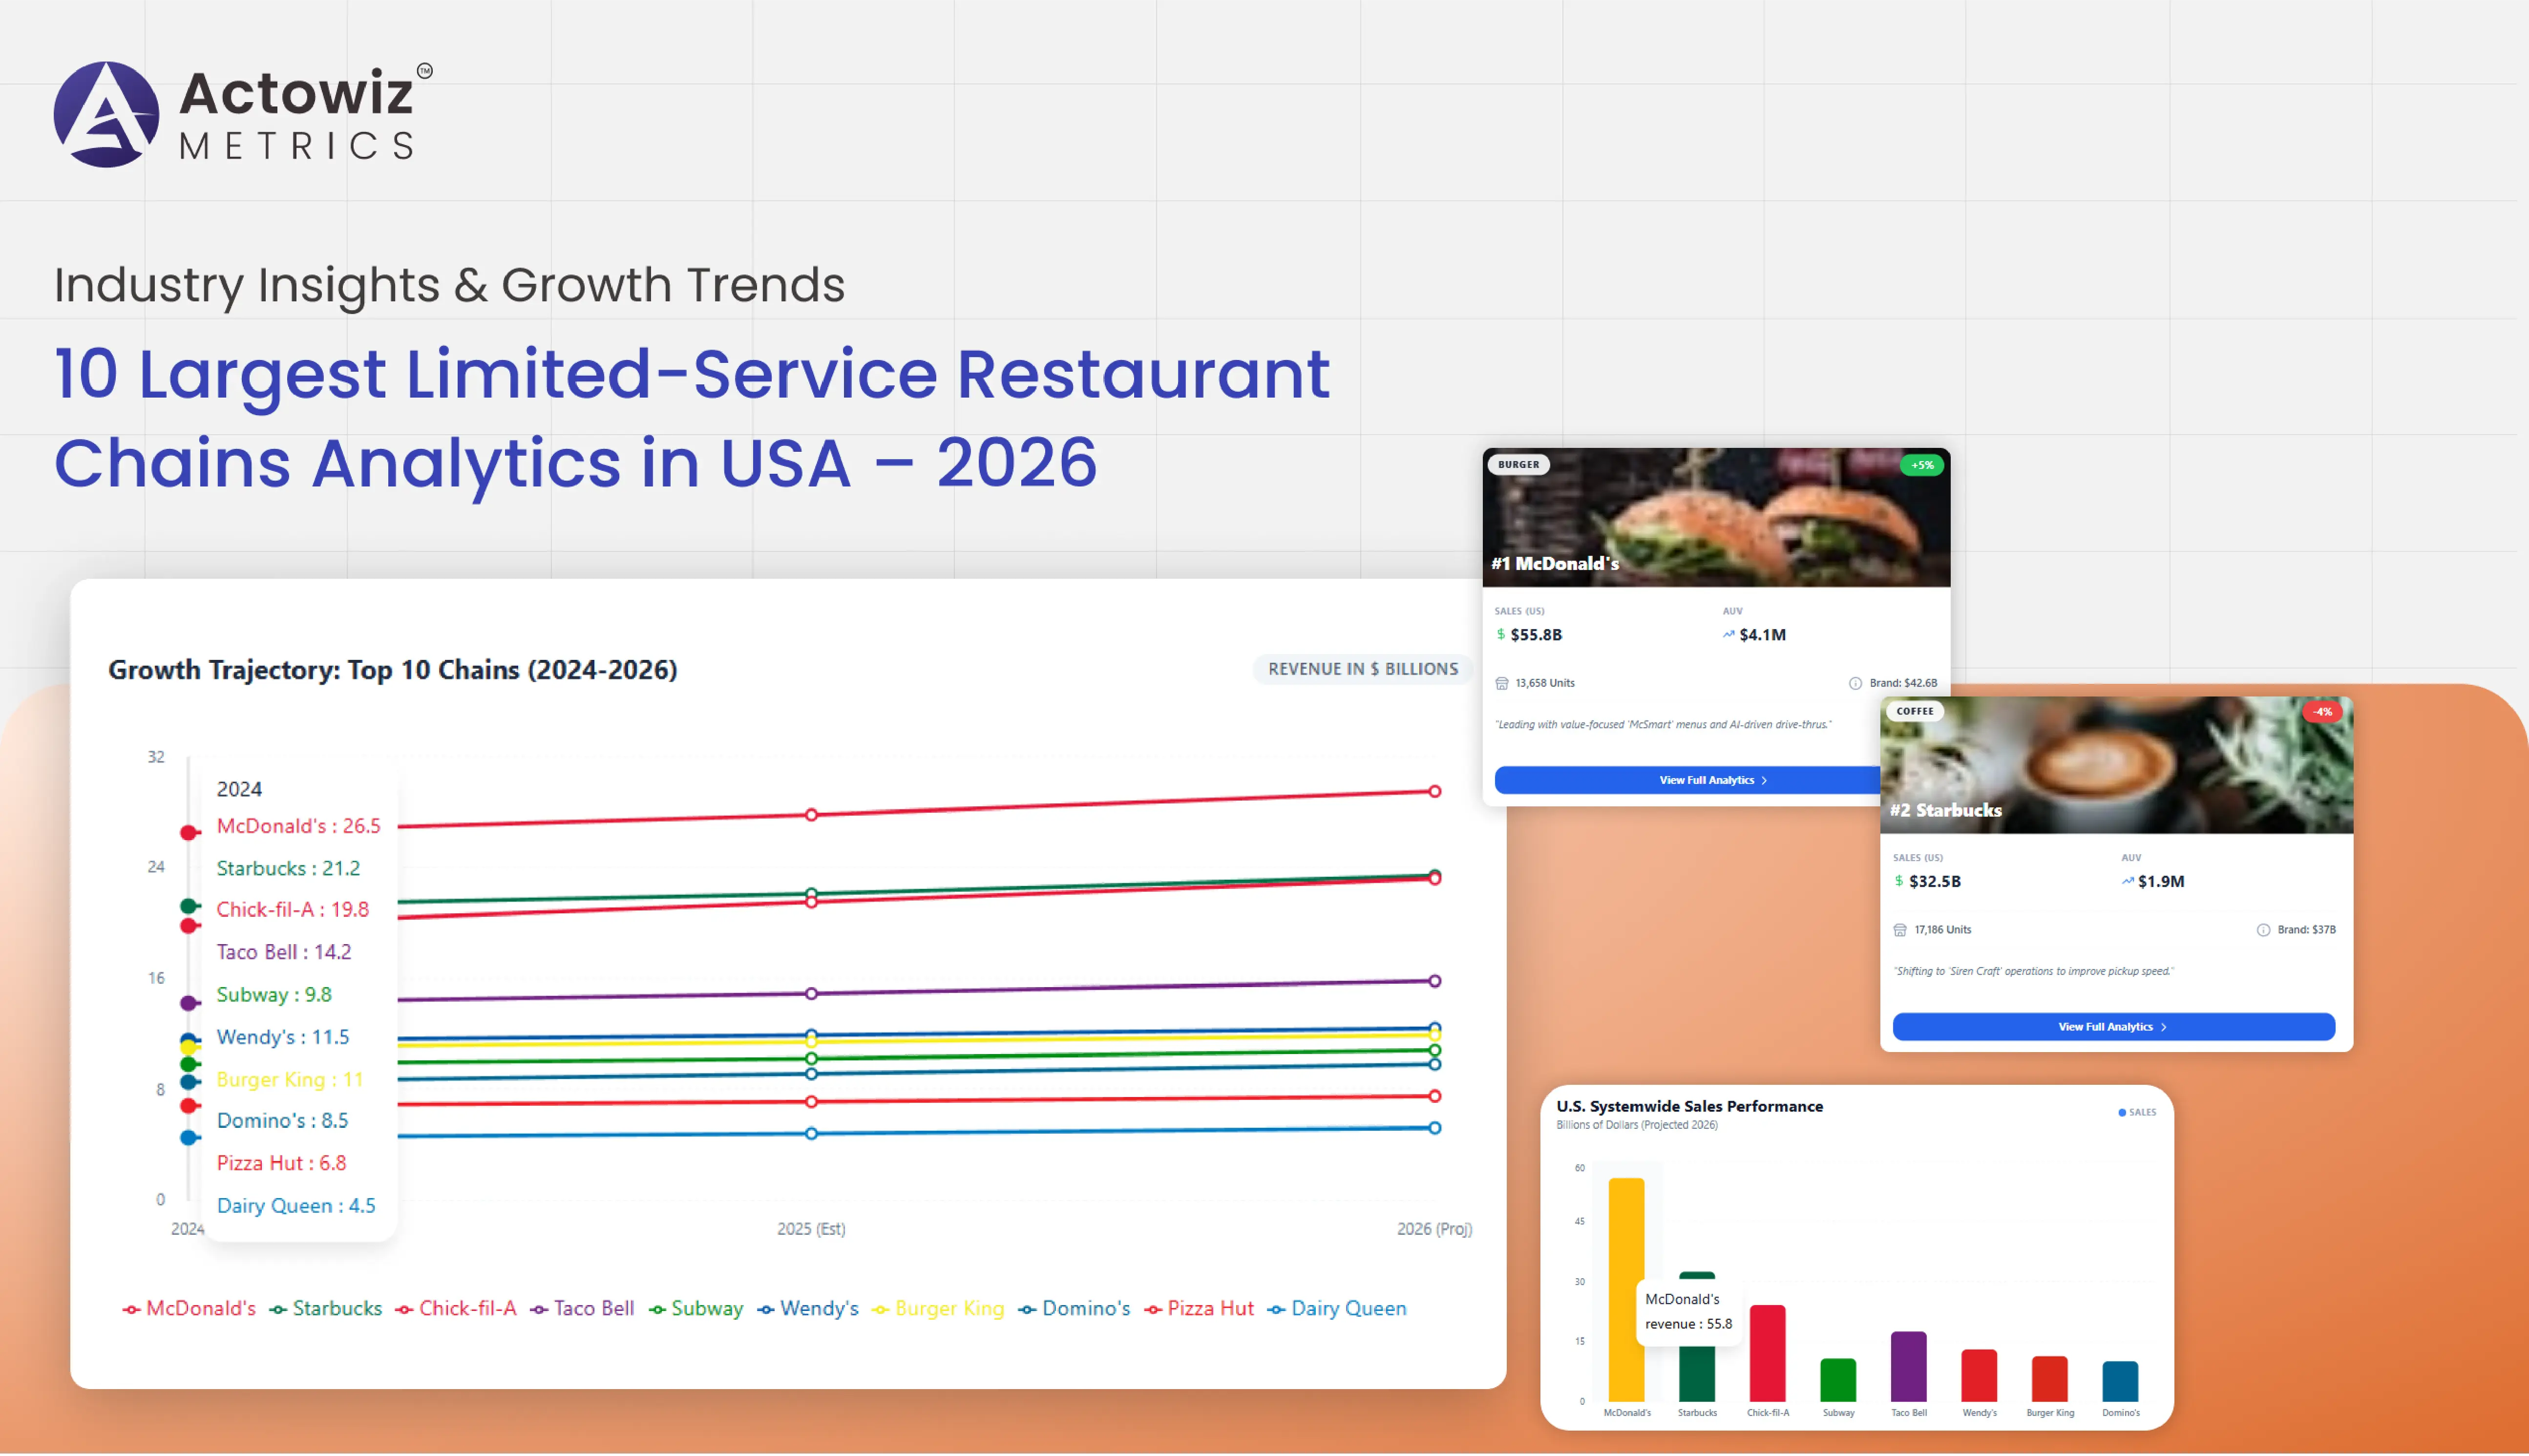
Limited-service restaurant chains dominate the U.S. foodservice landscape due to their efficiency, affordability, and strong brand recognition. From global burger giants to rapidly growing chicken chains, these companies are reshaping the dining experience through digital ordering platforms, drive-thru innovations, and mobile-first customer engagement strategies. Between 2020 and 2026, the industry experienced significant growth, particularly as delivery services and online ordering became essential revenue channels.
Data-driven insights are now critical for restaurants seeking to understand customer preferences, optimize menu pricing, and benchmark competitor performance. Using structured datasets and advanced analytics, companies can analyze revenue trends, store expansion, product popularity, and promotional strategies across major chains.
This research report explores the growth trajectory of the largest limited-service restaurant chains in the United States, highlighting competitive dynamics, operational expansion, and digital transformation trends shaping the industry.
Understanding market positioning requires the ability to Extract 10 Largest Limited-Service Restaurant Chains USA – 2026 datasets and evaluate long-term growth patterns. These insights enable deeper Brand Competition Analysis, revealing how major chains expanded their presence across the country between 2020 and 2026.
The limited-service restaurant industry has seen rapid expansion due to increased consumer demand for convenience and affordable meals. Brands have adopted aggressive expansion strategies through franchising, digital ordering platforms, and enhanced drive-thru services.
| Rank | Restaurant Chain | 2020 Stores | 2026 Stores | Growth % |
|---|---|---|---|---|
| 1 | McDonald's | 13,800 | 14,300 | 3.6% |
| 2 | Starbucks | 15,300 | 17,100 | 11.8% |
| 3 | Subway | 23,800 | 21,200 | -10.9% |
| 4 | Taco Bell | 7,200 | 8,300 | 15.3% |
| 5 | Burger King | 7,100 | 7,600 | 7.0% |
| 6 | Domino's | 6,100 | 7,300 | 19.7% |
| 7 | Chick-fil-A | 2,600 | 3,500 | 34.6% |
| 8 | Wendy’s | 5,800 | 6,400 | 10.3% |
| 9 | Dunkin' | 9,600 | 10,200 | 6.2% |
| 10 | Pizza Hut | 7,000 | 7,200 | 2.8% |
These figures highlight how chicken and pizza chains expanded rapidly while traditional sandwich brands faced increased competition.
Accurate restaurant intelligence often requires Web Scraping 10 Largest Limited-Service Restaurant Chains USA to gather structured data from digital platforms. This process supports comprehensive Product Data Tracking, enabling analysts to monitor menu pricing, product launches, and promotional campaigns.
Digital ordering channels now represent a significant share of restaurant revenue. Many chains generate more than 40% of their orders through mobile apps, delivery platforms, and online ordering portals. Data collected from these channels helps businesses understand customer preferences and identify high-performing menu categories.
| Chain | 2020 Revenue ($B) | 2023 Revenue ($B) | 2026 Revenue ($B) |
|---|---|---|---|
| McDonald's | 19.2 | 23.1 | 26.0 |
| Starbucks | 23.5 | 32.2 | 38.0 |
| Chick-fil-A | 11.3 | 18.0 | 22.5 |
| Domino's | 4.1 | 4.5 | 5.6 |
| Taco Bell | 11.7 | 14.0 | 17.2 |
The data indicates that quick-service chains investing heavily in mobile ordering and delivery partnerships experienced the fastest growth.
Advanced data extraction systems such as the Largest Limited Service Restaurant Chains Scraper USA 2026 allow companies to track digital storefronts, pricing changes, and promotional campaigns at scale. Automated scrapers continuously monitor restaurant websites and third-party delivery platforms, generating structured datasets for analytics.
Between 2020 and 2026, restaurant chains dramatically increased their digital capabilities. Online ordering, AI-driven recommendations, and loyalty apps became core components of their customer engagement strategies.
| Year | Online Order Share | Mobile App Orders | Delivery Platform Orders |
|---|---|---|---|
| 2020 | 18% | 12% | 10% |
| 2022 | 27% | 18% | 16% |
| 2024 | 36% | 25% | 22% |
| 2026 | 44% | 31% | 28% |
This rapid digital growth highlights why automated data monitoring tools are essential for understanding the competitive restaurant landscape.
Businesses increasingly rely on 10 Largest Limited-Service Restaurant Chains Scraping USA to analyze menu evolution and promotional strategies across major brands. Tracking menu data helps identify product innovation trends, including plant-based options, healthier menu items, and premium beverages.
Consumer demand for diverse menu offerings has influenced how chains structure their product portfolios. Fast-food brands have expanded beyond traditional burgers and sandwiches, adding specialty drinks, desserts, and global flavors.
| Category | 2020 Share | 2023 Share | 2026 Share |
|---|---|---|---|
| Burgers | 32% | 29% | 27% |
| Chicken | 21% | 24% | 27% |
| Coffee & Beverages | 18% | 21% | 23% |
| Pizza | 14% | 13% | 13% |
| Sandwiches | 15% | 13% | 10% |
Chicken and beverage segments experienced strong growth, driven by brands like Chick-fil-A and Starbucks.
Modern restaurant analytics platforms perform Competitive Data Scraping from 10 Largest Restaurant Chains USA to evaluate pricing strategies, promotional offers, and product launches. This approach enables restaurant brands and analysts to compare digital shelf performance across multiple competitors.
Competitive intelligence reveals which brands dominate specific product categories and geographic markets.
| Chain | Avg Burger Price | Avg Combo Meal | Avg Beverage |
|---|---|---|---|
| McDonald's | $5.10 | $8.20 | $2.40 |
| Burger King | $5.40 | $8.50 | $2.60 |
| Wendy’s | $5.30 | $8.40 | $2.50 |
| Chick-fil-A | $6.80 | $9.60 | $2.90 |
| Taco Bell | $4.20 | $7.10 | $2.30 |
These insights help brands benchmark their pricing strategies against competitors.
Modern restaurant operators increasingly rely on advanced Food Analytics to analyze consumer purchasing patterns and menu performance. Data insights reveal how customers interact with restaurant apps, digital menus, and delivery platforms.
Consumer preferences have shifted toward convenience, personalization, and faster service. Mobile apps and loyalty programs now play a major role in driving repeat purchases.
These trends demonstrate how technology continues to reshape the restaurant industry.
Actowiz Metrics delivers powerful analytics solutions that help businesses understand competitive market dynamics. With advanced Digital Shelf Analytics, companies can monitor product visibility, pricing trends, promotional strategies, and competitor performance across digital platforms.
Our analytics platforms combine web scraping technology, AI-powered insights, and scalable data pipelines to deliver reliable datasets for businesses. From restaurant analytics to retail intelligence, Actowiz Metrics provides actionable insights that enable smarter strategic decisions.
By transforming raw data into structured insights, organizations can track brand competition, analyze product performance, and monitor pricing strategies across multiple industries.
The U.S. limited-service restaurant industry continues to evolve rapidly, driven by digital transformation, competitive innovation, and changing consumer preferences. Insights from 10 Largest Limited-Service Restaurant Chains Analytics in USA – 2026 demonstrate how market leaders leverage technology, menu innovation, and strategic expansion to maintain their competitive advantage.
Advanced analytics tools also enable deeper Price Benchmarking, helping brands understand how their pricing strategies compare with competitors across different regions and product categories. As the restaurant industry becomes increasingly data-driven, access to reliable analytics will be critical for identifying growth opportunities and optimizing operations.
Contact Actowiz Metrics today to unlock powerful restaurant analytics insights and stay ahead in the competitive food service market!

Whatever your project size is, we will handle it well with all the standards fulfilled! We are here to give 100% satisfaction.
Any analytics feature you need — we provide it
24/7 global support
Real-time analytics dashboard
Full data transparency at every stage
Customized solutions to achieve your data analysis goals