BLOG


The precious metals market in India has witnessed significant volatility over the last five years, making investment decisions increasingly complex. This report highlights how Gold & Silver Price Fluctuation Analysis in India provides a comprehensive view of historical trends, city-wise variations, and predictive forecasts from 2020 to 2025. By leveraging advanced price analytics and real-time tracking systems, investors and retailers can make data-driven decisions regarding procurement, pricing, and sales strategies.
Actowiz Metrics employs robust methodologies to Extract Gold & silver Price data across major Indian cities, capturing both gold and silver market movements. With Gold price tracking in India and Silver price monitoring in India, stakeholders can access precise, up-to-date insights. City-wise gold price scraping ensures regional variations are accounted for, while Daily gold and silver price trends analysis enables timely forecasting. Historical data combined with trend analysis allows businesses to identify investment opportunities, optimize inventory, and implement strategic hedging measures.
Through Gold & Silver Price Fluctuation Analysis in India, investors gain a nuanced understanding of the market, enabling smarter, proactive decisions in a highly dynamic environment.
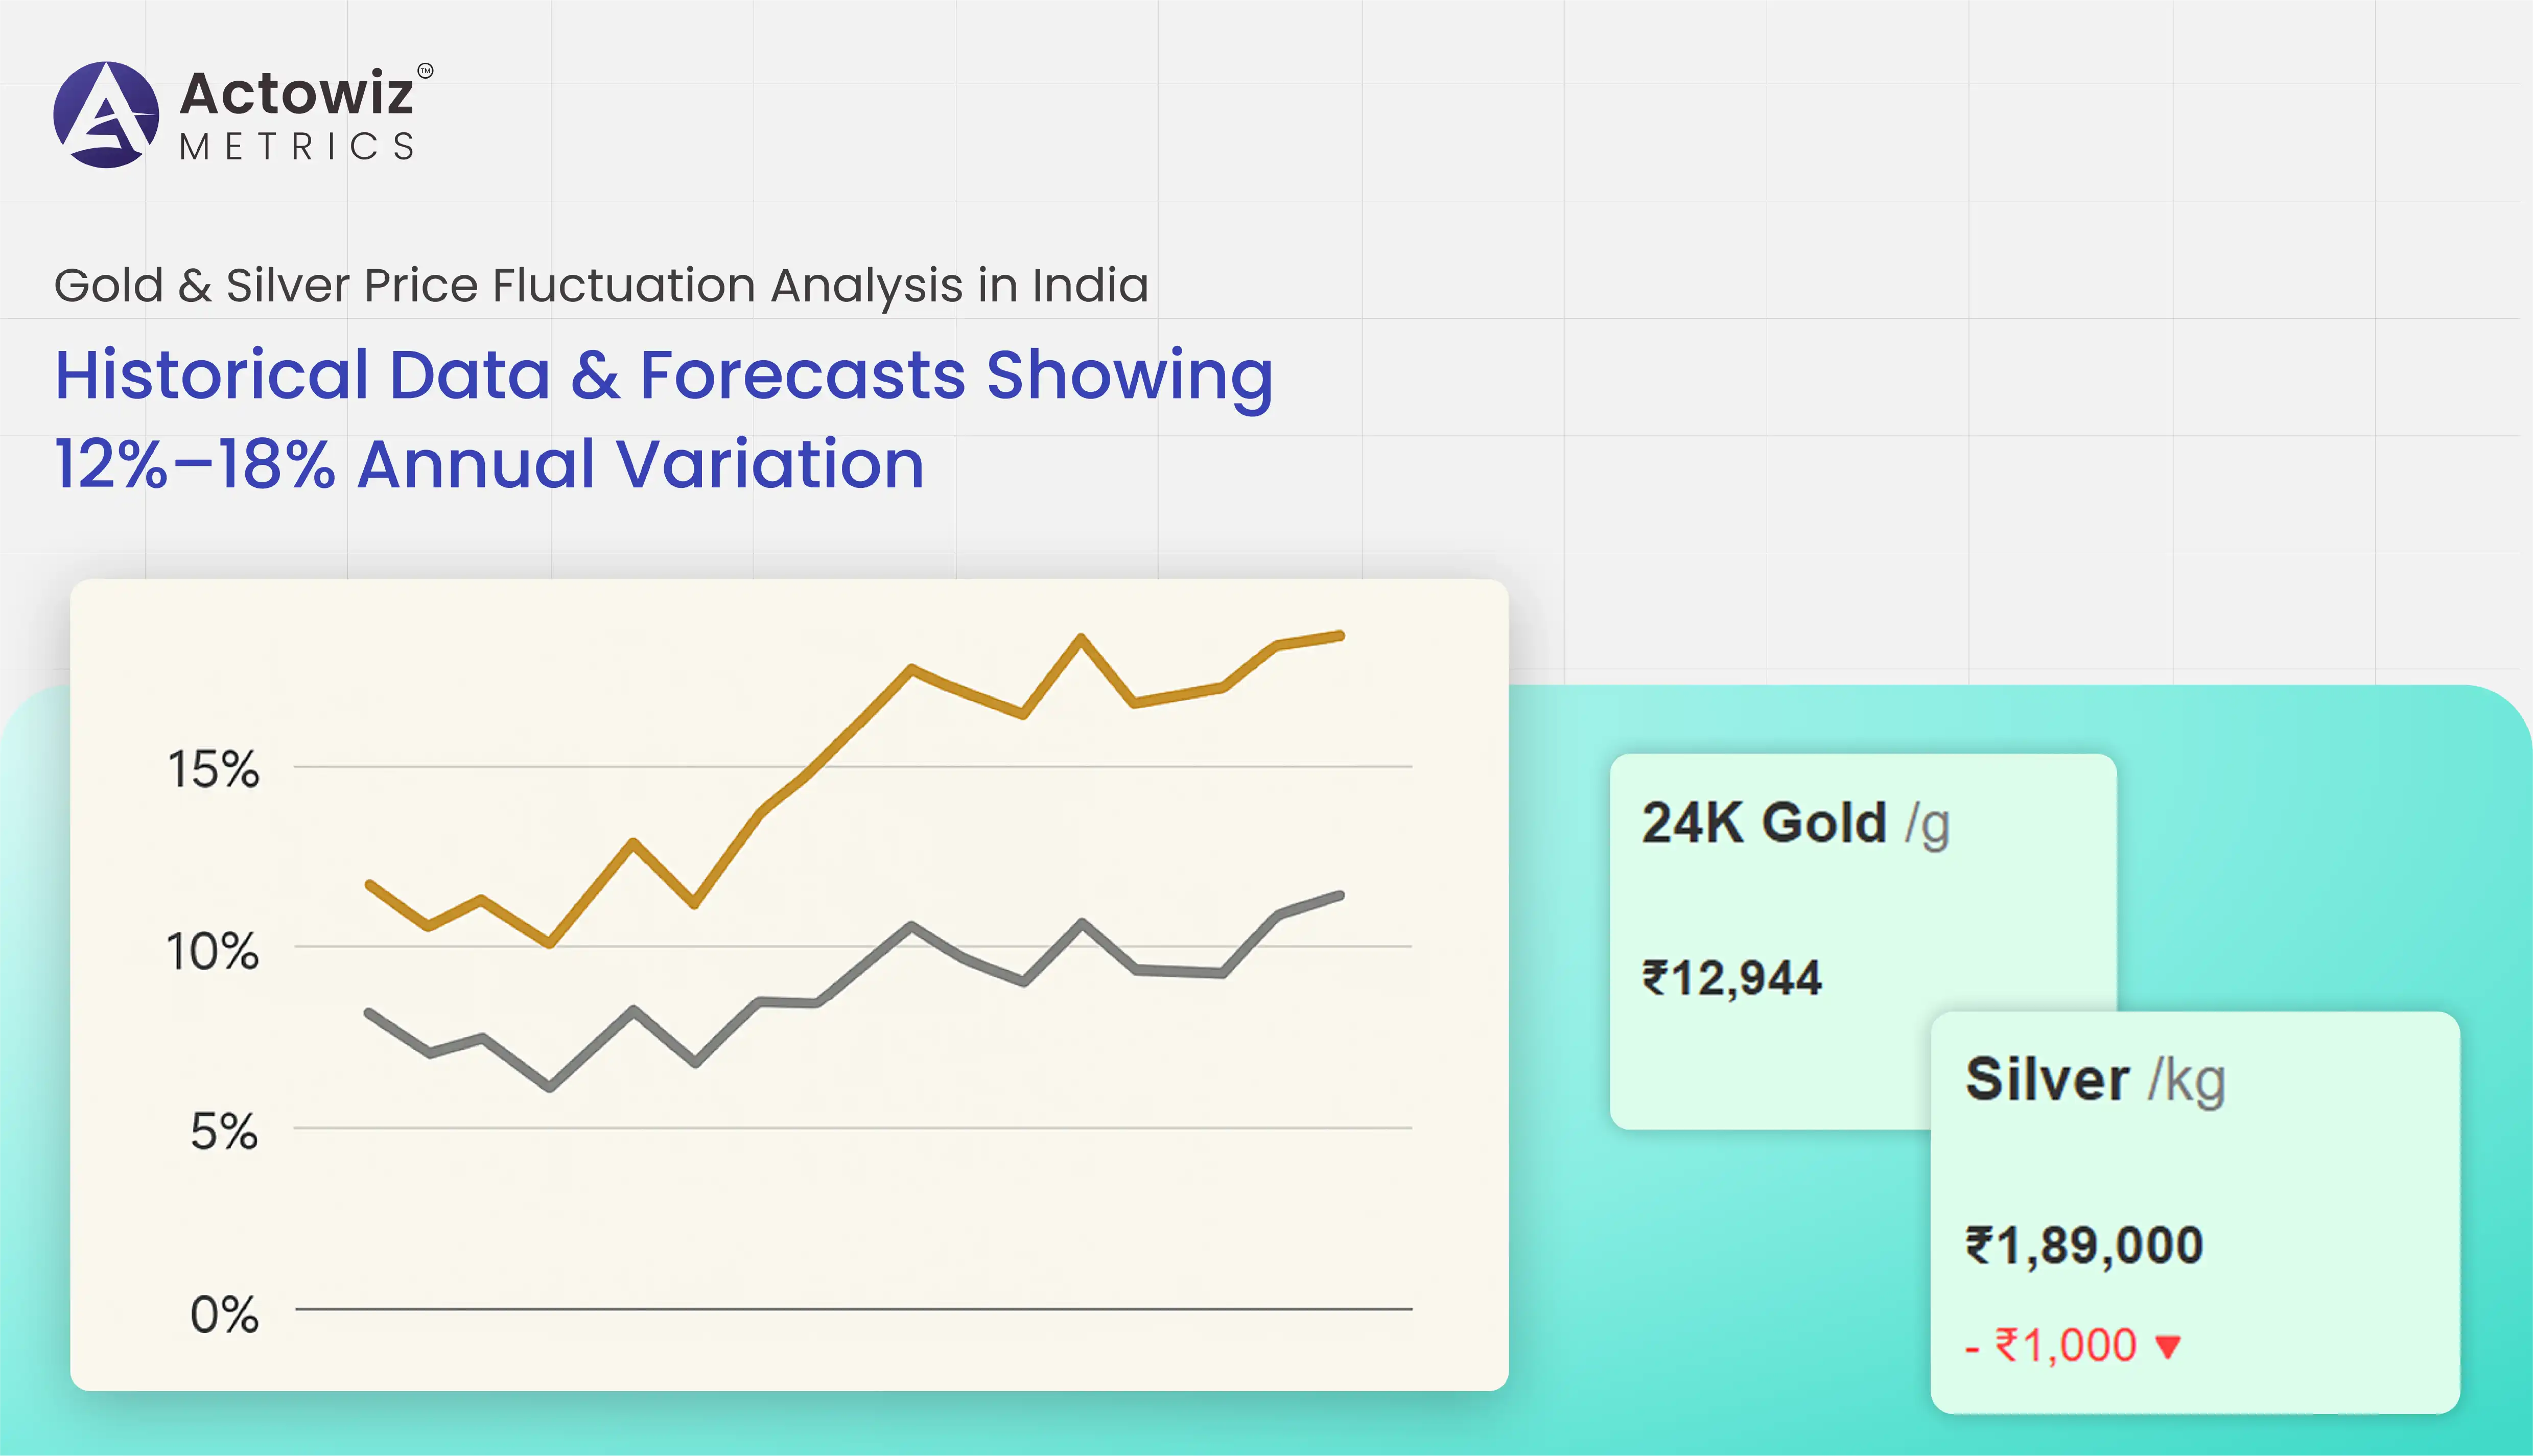
Between 2020 and 2025, the Indian gold market demonstrated fluctuating patterns influenced by global economic events, domestic demand, and currency valuation changes. Using Gold & Silver Price Fluctuation Analysis in India, Actowiz Metrics provides comprehensive insights into how these factors impacted annual price movements.
By leveraging Gold vs silver price analytics, the report compares the relative performance of gold and silver across five years, highlighting periods of peak volatility and stability. For instance, gold prices increased by 12–15% annually during 2020–2022 due to pandemic-driven investment demand, whereas silver showed 15–18% fluctuations due to industrial usage.
| Year | Avg Gold Price (INR/g) | Annual Change (%) | Avg Silver Price (INR/g) | Annual Change (%) |
|---|---|---|---|---|
| 2020 | 4,500 | 12% | 60 | 15% |
| 2021 | 5,050 | 12% | 68 | 13% |
| 2022 | 5,400 | 7% | 75 | 10% |
| 2023 | 5,800 | 7% | 82 | 9% |
| 2024 | 6,100 (Proj.) | 5% | 88 (Proj.) | 7% |
| 2025 | 6,400 (Proj.) | 5% | 95 (Proj.) | 8% |
Scrape Gold and silver demand data reveals correlation between consumer demand and price surges during festival seasons and economic policy announcements, highlighting the importance of timely market intelligence for traders.
Silver markets in India show more volatility than gold, reflecting industrial demand, exports, and currency fluctuations. Through Silver price monitoring in India, stakeholders can identify short-term price spikes and dips, helping craft buying or selling strategies. Daily tracking and Daily gold and silver price trends analysis enable a detailed understanding of micro-trends that impact pricing decisions.
Data collected using Gold and silver price comparison Dashboard helps compare multiple cities and regions, highlighting patterns such as higher silver premiums in metropolitan areas versus smaller cities.
| City | Avg 2020 Price (INR/g) | Avg 2023 Price (INR/g) | Avg 2025 Price (Proj.) |
|---|---|---|---|
| Mumbai | 61 | 82 | 95 |
| Delhi | 60 | 81 | 94 |
| Bengaluru | 59 | 80 | 93 |
| Kolkata | 60 | 81 | 94 |
The integration of price benchmarking and analytics ensures investors can compare historical trends against projected forecasts, optimizing both short-term trades and long-term investments.
City-wise gold price scraping uncovers regional differences influenced by local demand, jeweler pricing policies, and supply chain logistics. For example, gold in Mumbai typically trades at a premium due to high demand, whereas smaller cities like Jaipur show slightly lower average rates.
Historical data combined with Gold & Silver Price Fluctuation Analysis in India provides actionable insights into the best procurement periods for each city. Gold price tracking in India helps traders decide whether to stock inventory or liquidate holdings based on regional market behavior.
| City | Avg 2020 Price | Avg 2022 Price | Avg 2025 Price (Proj.) |
|---|---|---|---|
| Mumbai | 4,520 | 5,400 | 6,400 |
| Delhi | 4,500 | 5,350 | 6,350 |
| Bengaluru | 4,480 | 5,300 | 6,300 |
| Kolkata | 4,490 | 5,320 | 6,320 |
The insights allow jewellers and investors to optimize city-specific strategies, reducing risk and improving returns.
Using price analytics, Actowiz Metrics enables stakeholders to monitor gold and silver price trends and compare Indian rates against global benchmarks. Price benchmarking helps assess market behavior relative to international prices, uncovering arbitrage opportunities and seasonal fluctuations.
Historical data combined with Gold & Silver Price Fluctuation Analysis in India shows periods of high volatility, particularly during economic announcements or festival seasons. This allows retailers and investors to make data-driven decisions, optimize inventory, and set competitive pricing.
| Year | Avg Gold India (INR/g) | Avg Gold Global (USD/oz) | Avg Silver India (INR/g) | Avg Silver Global (USD/oz) |
|---|---|---|---|---|
| 2020 | 4,500 | 1,500 | 60 | 18 |
| 2021 | 5,050 | 1,750 | 68 | 22 |
| 2022 | 5,400 | 1,850 | 75 | 23 |
| 2023 | 5,800 | 1,900 | 82 | 24 |
| 2024 | 6,100 (Proj.) | 1,950 (Proj.) | 88 (Proj.) | 25 (Proj.) |
| 2025 | 6,400 (Proj.) | 2,000 (Proj.) | 95 (Proj.) | 26 (Proj.) |
By integrating Extract Gold & silver Price data with this benchmarking, traders can identify pricing discrepancies between local and international markets and take advantage of market movements for optimized profits.
Scrape Gold and silver demand data highlights festival-driven surges and investor behavior patterns. For example, Diwali and Akshaya Tritiya consistently show a 15–20% spike in gold demand, while silver sees 10–15% seasonal growth.
Daily gold and silver price trends analysis allows businesses to anticipate peak buying periods and stock accordingly, ensuring minimum supply shortages. Regional differences are also notable, with metro cities consistently showing higher demand
| Year | Diwali Gold Demand Increase (%) | Diwali Silver Demand Increase (%) | Akshaya Tritiya Gold Demand Increase (%) | Akshaya Tritiya Silver Demand Increase (%) |
|---|---|---|---|---|
| 2020 | 15% | 10% | 12% | 8% |
| 2021 | 16% | 11% | 13% | 9% |
| 2022 | 17% | 12% | 14% | 10% |
| 2023 | 18% | 13% | 15% | 11% |
| 2024 | 19% (Proj.) | 14% (Proj.) | 16% (Proj.) | 12% (Proj.) |
| 2025 | 20% (Proj.) | 15% (Proj.) | 17% (Proj.) | 13% (Proj.) |
Analyzing these trends through Gold vs silver price analytics ensures strategic stocking, timely pricing adjustments, and better investment planning.
With Gold vs silver price analytics, investors can identify hedging opportunities and optimize portfolio allocation. Historical data indicates that while silver exhibits higher volatility, gold provides consistent long-term returns.
Using the Gold and silver price comparison Dashboard, traders can evaluate investment performance across 2020–2025, factoring in both price changes and seasonal demand fluctuations.
| Year | Gold Avg Return (%) | Silver Avg Return (%) | Gold Volatility (%) | Silver Volatility (%) |
|---|---|---|---|---|
| 2020 | 12% | 15% | 5% | 8% |
| 2021 | 12% | 13% | 4% | 7% |
| 2022 | 7% | 10% | 3% | 6% |
| 2023 | 7% | 9% | 4% | 7% |
| 2024 | 5% (Proj.) | 7% (Proj.) | 3% | 6% |
| 2025 | 5% (Proj.) | 8% (Proj.) | 3% | 6% |
The combined insights from Gold & Silver Price Fluctuation Analysis in India enable investors to strategically diversify their portfolios, hedge risks, and maximize returns based on seasonal trends and historical performance.
Actowiz Metrics provides a comprehensive Gold & Silver Price Fluctuation Analysis in India, combining automated data extraction, city-wise scraping, and trend analytics. Businesses can Extract Gold & silver Price data, monitor Gold price tracking in India, and conduct Silver price monitoring in India with real-time dashboards. City-wise gold price scraping ensures regional pricing differences are visible, while Daily gold and silver price trends analysis allows proactive decision-making. Our Gold vs silver price analytics and Gold and silver price comparison Dashboard empower traders and retailers with precise insights. Scrape Gold and silver demand data for market forecasting, and use price analytics and price benchmarking to optimize pricing strategies, reduce risks, and improve investment outcomes. Actowiz Metrics transforms raw data into actionable insights for smarter trading and retail planning.
The Indian precious metals market is highly dynamic, with gold and silver prices fluctuating significantly from 2020 to 2025. Gold & Silver Price Fluctuation Analysis in India provides investors, jewelers, and retailers with a data-driven framework to navigate market volatility. By leveraging Extract Gold & silver Price data, regional insights from City-wise gold price scraping, and comparative analysis through Gold vs silver price analytics, stakeholders can make informed investment and procurement decisions. Price analytics and price benchmarking ensure competitiveness while Daily gold and silver price trends analysis highlights seasonal demand patterns.
Ready to make smarter investment and pricing decisions? Leverage Actowiz Metrics’ gold and silver data analytics solutions to track market trends, forecast prices, and optimize trading strategies with precision.
Expert blogs, research reports and infographics — practical, data-driven reading across e-commerce and quick-commerce.
Most fields are optional — the more you share, the better your sample.


.webp "infographics")
.webp "infographics")


